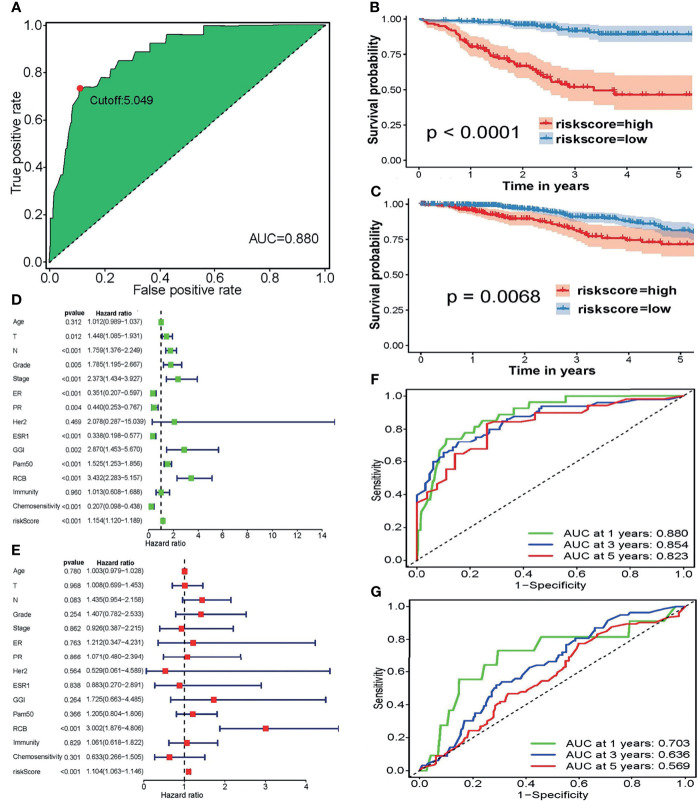
Figure 5.
(A) The optimal cutoff points in the ROC curve with the maximum AUC. (B, C) The survival curves to estimate the difference in the survival time between the high-risk and low-risk groupings in the (B) training and (C) validation sets. (D, E) Forest plots of the training set using (D) univariate and (E) multivariate independent prognostic analyses. (F, G) To evaluate the accuracy of our risk model, 1-, 3-, and 5-year ROC curves were plotted in the (F) GEO and (G) TCGA datasets.

