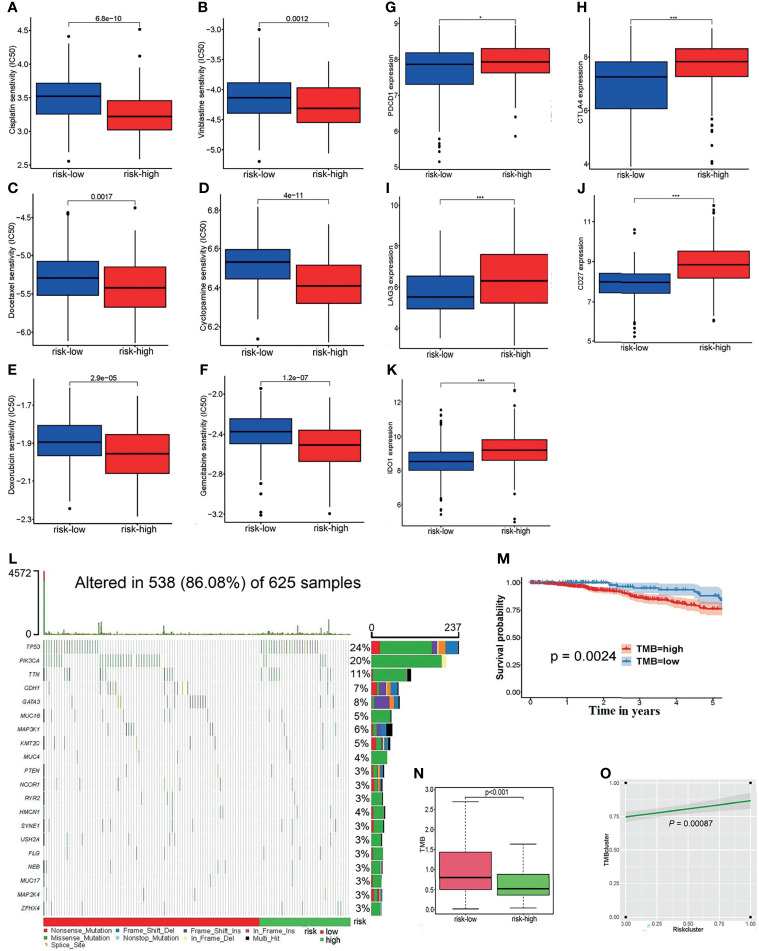
Figure 7.
(A–F) The linkages between the risk grouping and some common chemotherapy agents for BC, for example, (A) cisplatin, (B) vinblastine, (C) docetaxel, (D) cyclopamine, (E) doxorubicin, and (F) gemcitabine. (G–K) Analyses of the relationship of ICs with the risk score, including (G) PDCD1, (H) CTLA4, (I) LAG3, (J) CD27, and (K) IDO1. (L) The waterfall diagram of the altered genes in 625 samples. (M) The survivorship curve indicates that patients with low TMB scores have a longer survival time (P = 0.0024). (N) The boxplot reflects the correlation between the risk cluster and the TMB score (p = 0.0024). (O) There was a positive association between the risk clusters and TMB clusters (p = 0.00087).*p < 0.05, ***p < 0.001.

