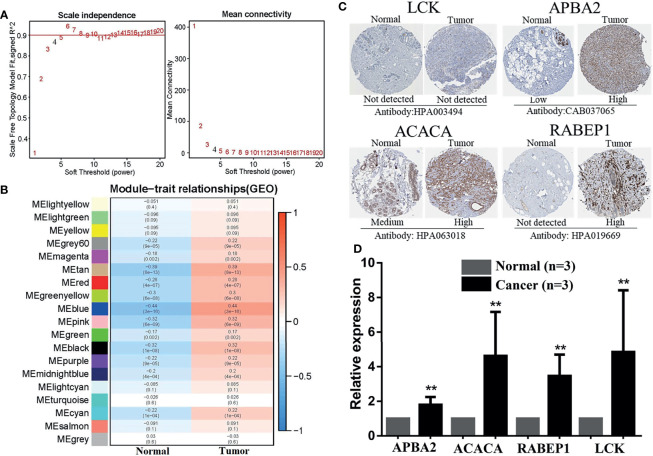
Figure 8.
Identification and exploration of hub DECIRGs pairs. (A) Determination of soft-thresholding power. When soft threshold comparable to 4, R 2 > 0.8 and mean connectivity < 100, the network was scale-free topology. (B) Module–trait associations: Each row corresponds to a module and each column to a trait (low-risk and high-risk). (C) The IHC staining images of LCK, APBA2, ACACA, and RABEP1. (D) The mRNA expression analysis of LCK, APBA2, ACACA, and RABEP1 by qRT-PCR. **p < 0.01.

