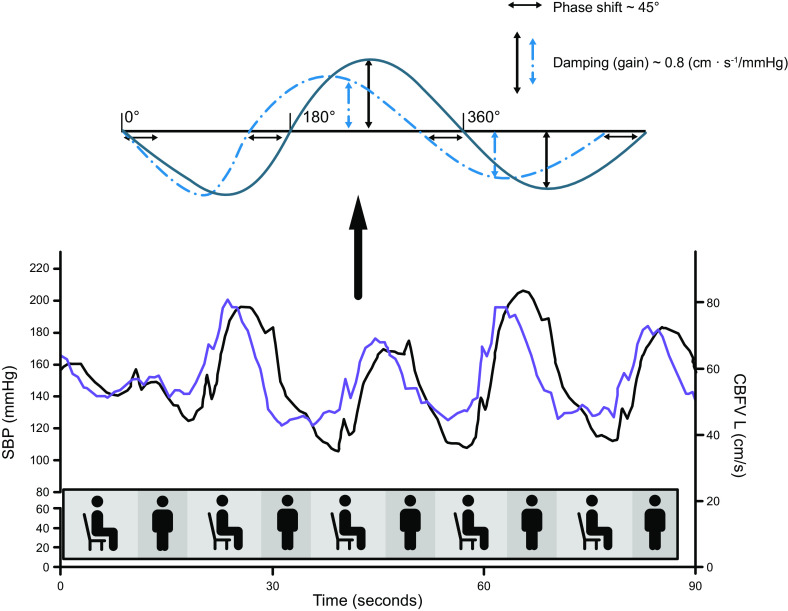
FIGURE 5.
With the use of a zoomed-in section of the data presented in FIGURE 4, this graph illustrates the relationship between changes in blood pressure (BP; black line) and cerebral blood flow (CBF) (blue line) induced by the repeated sit-to-stand maneuvers at 0.05 Hz, see details in the legend for FIGURE 4. Bottom: the timing of these sit-stand maneuvers is schematically illustrated in the graph. Note that the BP and CBF graphs are not fully synchronous; this is an effect of autoregulation. The leftward shift of CBF [here, represented by the left middle cerebral artery blood velocity (CBFVL) signal recorded with transcranial Doppler] compared with BP [systolic BP (SBP) measured using Finapres] is referred to as phase shift. Phase shift is one of the parameters that follows from transfer function analysis. Top: inserted graph is a schematic explanation of phase shift. If we consider the repeated changes in BP and CBF as an oscillatory signal, resembling a sinusoid with a period of 360°, the leftward shift of CBF can be quantified in degrees (or converted to radians), in this example ∼40–50°, which in this frequency (0.05 Hz, the very-low-frequency range) indicates normal dynamic autoregulation. The parameter gain is also illustrated, representing damping, where effective dynamic autoregulation will result in relatively smaller changes in CBF compared with BP. Because BP and CBF have different physical units, gain is not necessarily below 1.

