FIGURE 1.
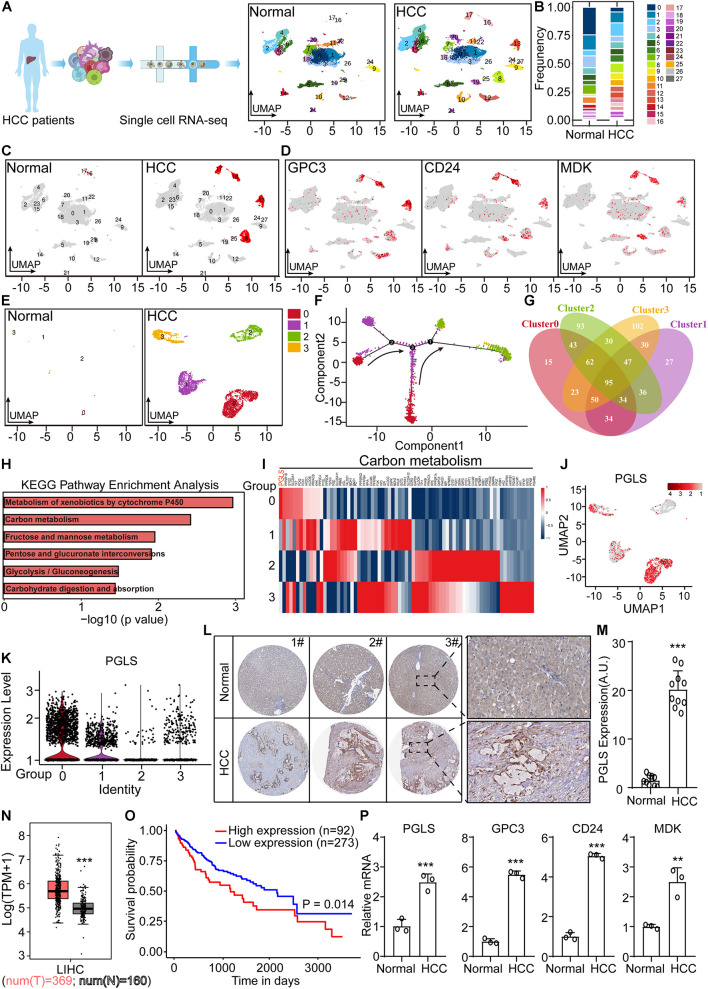
PGLS was specifically highly expressed in human HCC samples. (A) The UMAP dimensionality reduction results of scRNA-seq data from non-tumor and HCC patients. (B) The frequency of cells in each cluster. (C) Four more clusters presented in HCC samples. (D) These four cell clusters were labeled by HCC markers (GPC3, CD24, and MDK). (E) Four clusters specifically presented in HCC samples. (F) The pseudotime trajectory analysis was done for the above four clusters, which showed that cluster 0 was the most primitive. (G) The overlapped marker genes among the new four clusters. (H) KEGG enrichment using the specifically high expression genes in new cluster 0. (I) High expression genes in new cluster 0, in carbon metabolism. (J) The expression of PGLS in the UMAP plot. (K) The expression of PGLS in the violin plot. (L) The expressions of PGLS in normal and HCC samples were detected by IHC staining. (M) The quantitative results of IHC staining in normal and HCC samples. (N) PGLS mRNA expressions between HCC tissue (n = 369) and non-tumor liver tissue (n = 160) of TCGA and GTE database. (O) The survival curve for the HCC patients. (P) The differential expressed marker genes between non-tumor and HCC samples. Data show individual values and mean ± SD. m, n, and p, unpaired two-tailed Student t-tests, assessed statistical significance, **p < 0.01, ***p < 0.001.

