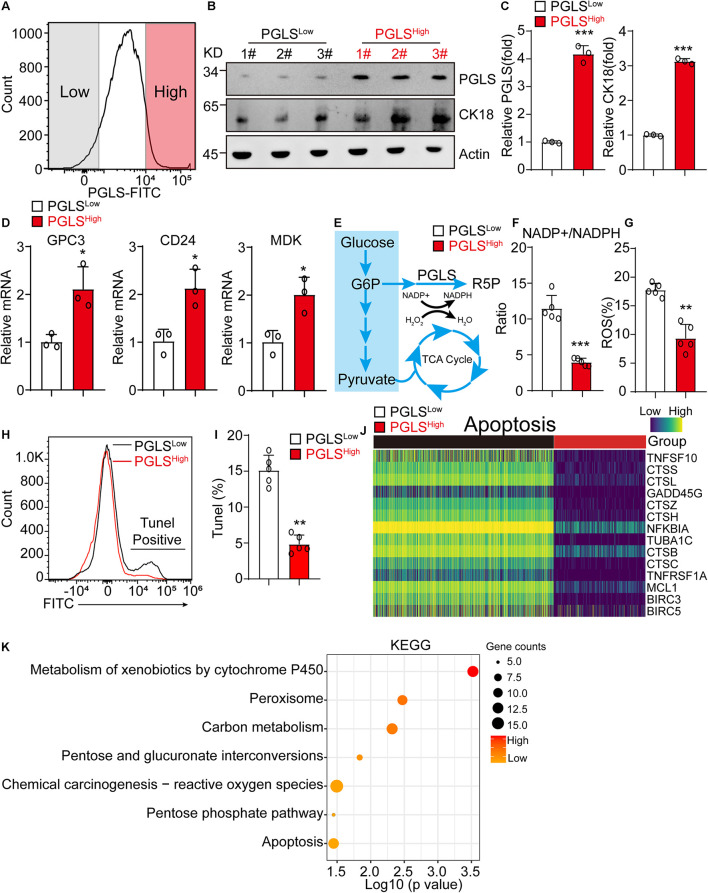
FIGURE 2.
PGLS pathway led to significant activation of PPP in HCC. (A) The representative FACS plot of PGLShigh and PGLSlow HCC cells. (B,C) Western blot of the PGLS and CK18 in PGLShigh and PGLSlow cells from human HCC patients. β-Actin is a loading control. (D) The relative expression of HCC marker genes in PGLShigh and PGLSlow cells (n = 3 replicates). (E) Glycometabolism diagram. (F) The NADP+/NADPH ratio in PGLShigh and PGLSlow cells (n = 5 replicates). (G) The percentage of ROS in PGLShigh and PGLSlow cells (n = 5 replicates). (H) The representative FACS plot of PGLShigh and PGLSlow cells for apoptosis analysis. (I) The apoptosis rate of PGLShigh and PGLSlow cells. (J) The expression profile of genes associated with apoptosis pathway between PGLShigh and PGLSlow cells. (K) KEGG analysis of PGLShigh and PGLSlow cells. Data show individual values and mean ± SD. (C,D,F,G,I) Unpaired two-tailed Student t-tests, assessed statistical significance, *p < 0.05, **p < 0.01, ***p < 0.001.

