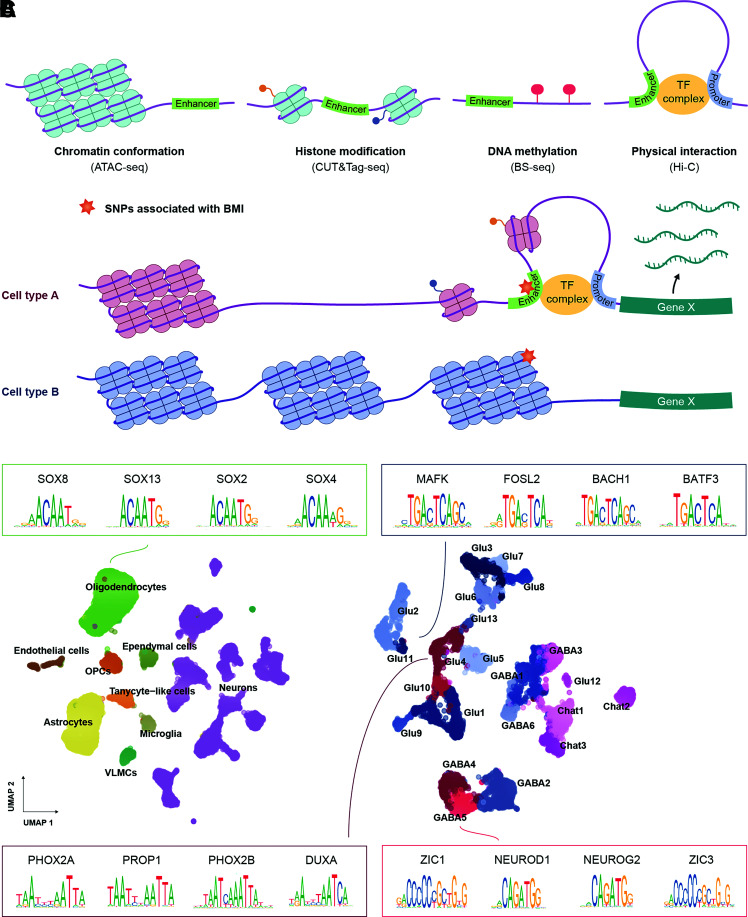
Figure 2.
Single-cell epigenetic techniques and landscape of incretin receptor DVC cells. A: Graphical illustration of the epigenetic features regulating enhancer activity. Enhancers typically reside in DNA stretches found in open chromatin, with high levels of active histone marks, devoid of cytosine methylation and in physical proximity to gene promoter regions. These features can be measured at single-cell resolution using the indicated assays. B: Graphical illustration of how single-cell epigenetic profiling can predict cell type–specific enhancers mediating genetic risk to human obesity. Colocalization of a BMI-associated genetic variant with the active enhancer in cell type A suggests that the genetic variant exerts its effect on obesity risk by modifying expression of the associated effector gene X in cell type A (and not cell type B). C: UMAP plots of 22,545 cells and 11,651 neurons from the snATAC-seq atlas provided by Ludwig et al. (16). The top four most enriched motifs in incretin receptor–expressing cells are shown by their position weight matrices; at each position of a given motif, the relative distribution of a given nucleotide is depicted. SNP, single nucleotide polymorphism; TF, transcription factor.

