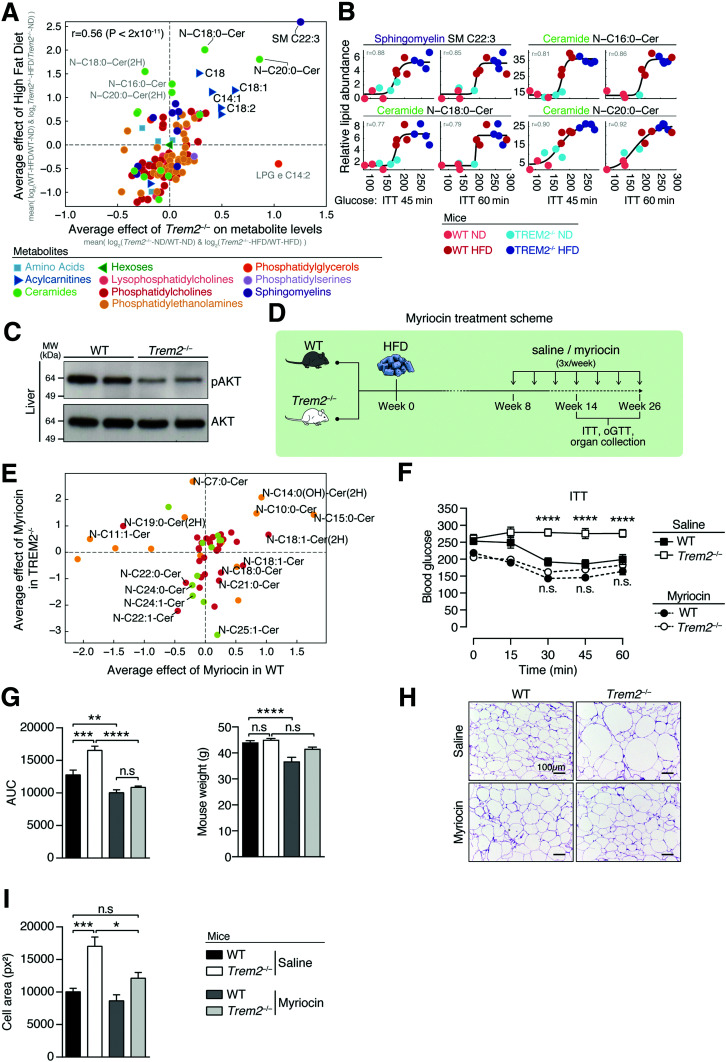
Figure 4.
Metabolic stress is required for the protective effects of TREM2, which are linked to elevated sphingolipids levels. A: Log2 fold change (FC) in metabolite abundance for Trem2–/– over WT mice averaged over both dietary conditions compared with log2(FC) metabolite levels of HFD over ND averaged over both genetic groups (n = 3 or 4 mice per genotype following 14 weeks of ND or HFD, respectively). B: Glucose levels (x-axis) vs. relative abundance of selected lipids (y-axis) following 45 and 60 min of insulin challenge. Dots represent mice, colored as indicated in the key. C: Activation of liver AKT signaling 5 min post–insulin injection in both genotypes fed an HFD for 13 weeks. D: Scheme for sphingolipid blockage. WT or Trem2–/– mice were placed on an HFD for 13 or 26 weeks. Eight weeks post-DIO, mice were injected three times weekly with saline control or myriocin at a dose of 0.5 mg/kg and maintained on an HFD. E: Log2FC in average abundance of short-, long-, and ultra-long-chain ceramides for both genotypes of myriocin-treated animals compared with saline controls (n = 4 mice per condition 26 weeks post-HFD). F: Insulin tolerance test (ITT) of both genotypes of mice in the context of sphingolipid blockage 13 weeks post-HFD (n = 8–9 mice per condition). G: Area under the curve (AUC) and mouse weights of data in panel F. H: Representative hematoxylin-eosin staining of eWAT 13 weeks post-HFD of animals in panels F and G (n = 8–9 mice per condition). I: Quantification of adipocyte cell size in panel H. Data are mean ± SEM. Statistical analysis was performed with two-way ANOVA followed by Bonferroni posttest (F) or one-way ANOVA followed by Tukey posttest (G and I). *P < 0.05, **P < 0.01, ***P < 0.001, ****P < 0.0001. MW, molecular weight; oGTT, oral glucose tolerance test; px2, square pixels.

