Figure 7.
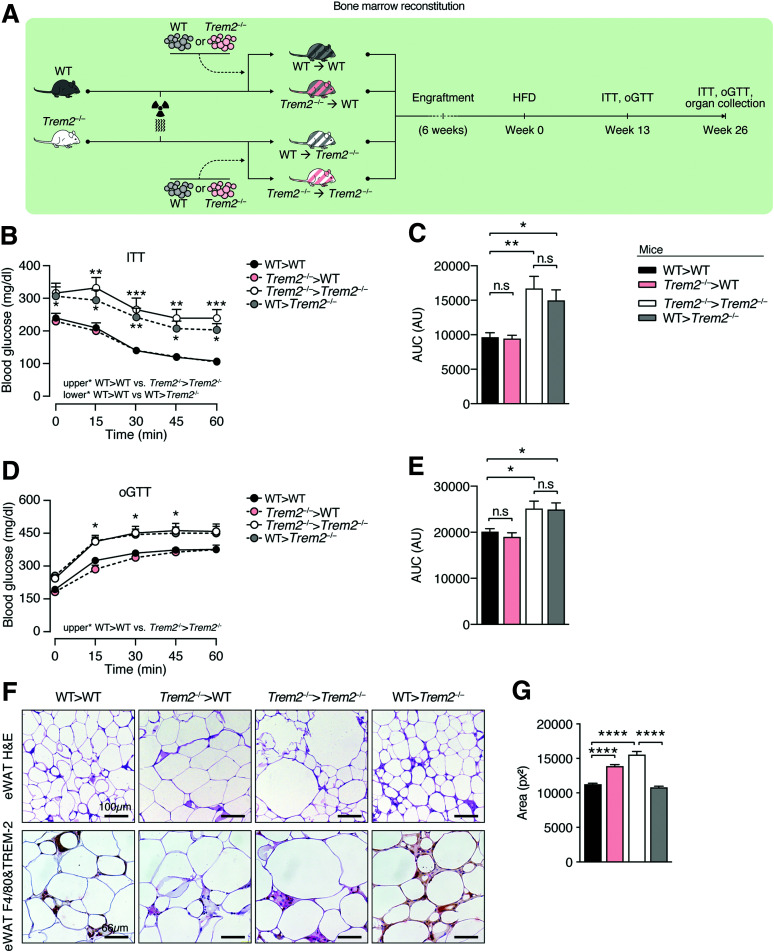
Uncoupling of effects of hematopoietic-expressed TREM2 on adipose hypertrophy and metabolic health. A: Scheme for BM transplantation studies. WT or Trem2–/– mice were lethally irradiated and transplanted with either WT or Trem2–/– BM to generate four groups of mice: WT>WT, Trem2–/–>Trem2–/– or Trem2–/–>WT, and WT>Trem2–/–. Posttransplant mice were maintained on an ND for 6 weeks, following which DIO was instigated. B: Insulin tolerance test (ITT) 13 weeks post-HFD. C: Area under the curve (AUC) of data in panel B. D: Oral glucose tolerance test (oGTT) 13 weeks post-HFD. E: AUC of data in panel D. F: Representative hematoxylin-eosin (H&E), TREM2, and F4/80 staining of eWAT of BM-transplanted mice 26 weeks post-HFD. G: Quantification of adipocyte cell size in H&E staining from panel F. Data correspond to size quantification of 3,868, 3,147, 3,198, and 4,412 adipocytes in WT>WT, Trem2–/–>WT, Trem2–/–>Trem2–/–, and WT>Trem2–/– mice, respectively. Data are mean ± SEM and are pooled from two independent experiments (n = 10–13 mice per genotype). Statistical analysis was performed with two-way ANOVA followed by Bonferroni posttest (B and D) or one-way ANOVA followed by Tukey posttest (C, E, and G). *P < 0.05, **P < 0.01, ***P < 0.01, ****P < 0.0001. AU, arbitrary unit; px2, square pixels.

