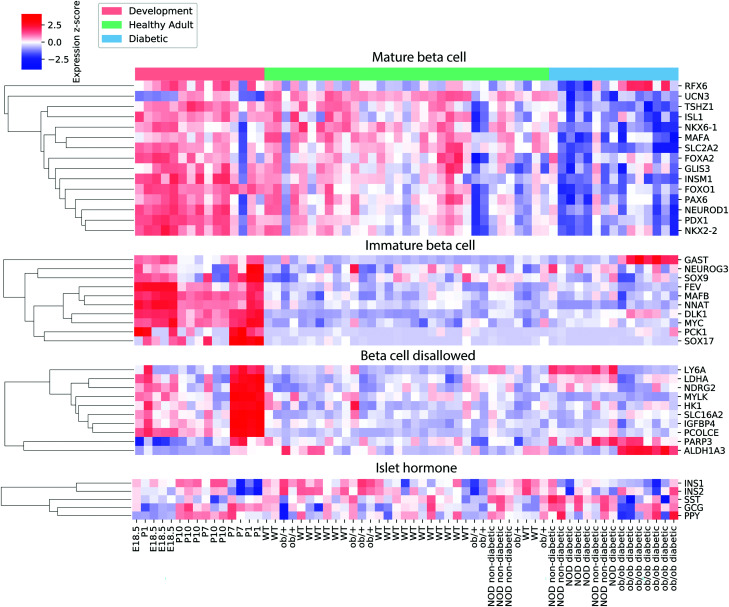
Figure 4.
Expression of selected β-cell maturation genes, β-cell “disallowed” genes, markers of immature β-cells and non–insulin-expressing precursors, and islet hormones. Each element in the heat map is colored according to the z score of the log-counts per million for the given gene and sample. Genes are hierarchically clustered using agglomerative clustering.

