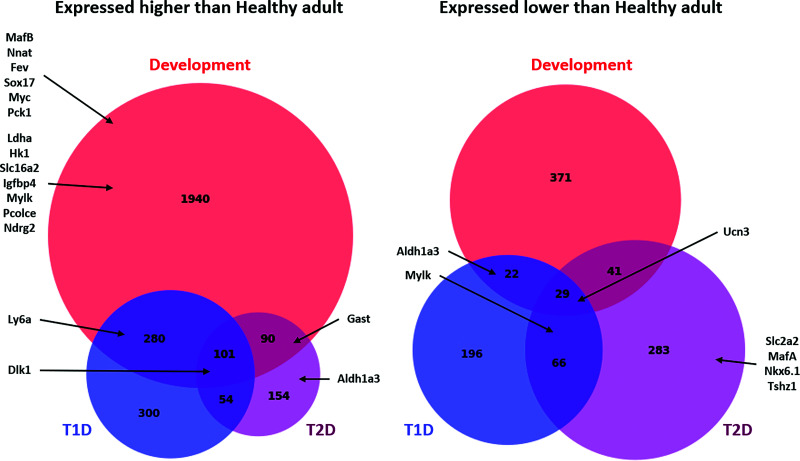
Figure 5.
Comparison of gene-specific expression changes during β-cell maturation and dedifferentiation in T1D and T2D. BioVenn diagram showing the number of genes upregulated and downregulated (1.5-fold, q < 0.05) in each group compared with the healthy adult group. Representative genes enriched in each category are also presented. For a list of all genes in each group, enriched GO terms, and enriched KEGG pathways in each group, see Supplementary Tables 1–4.

