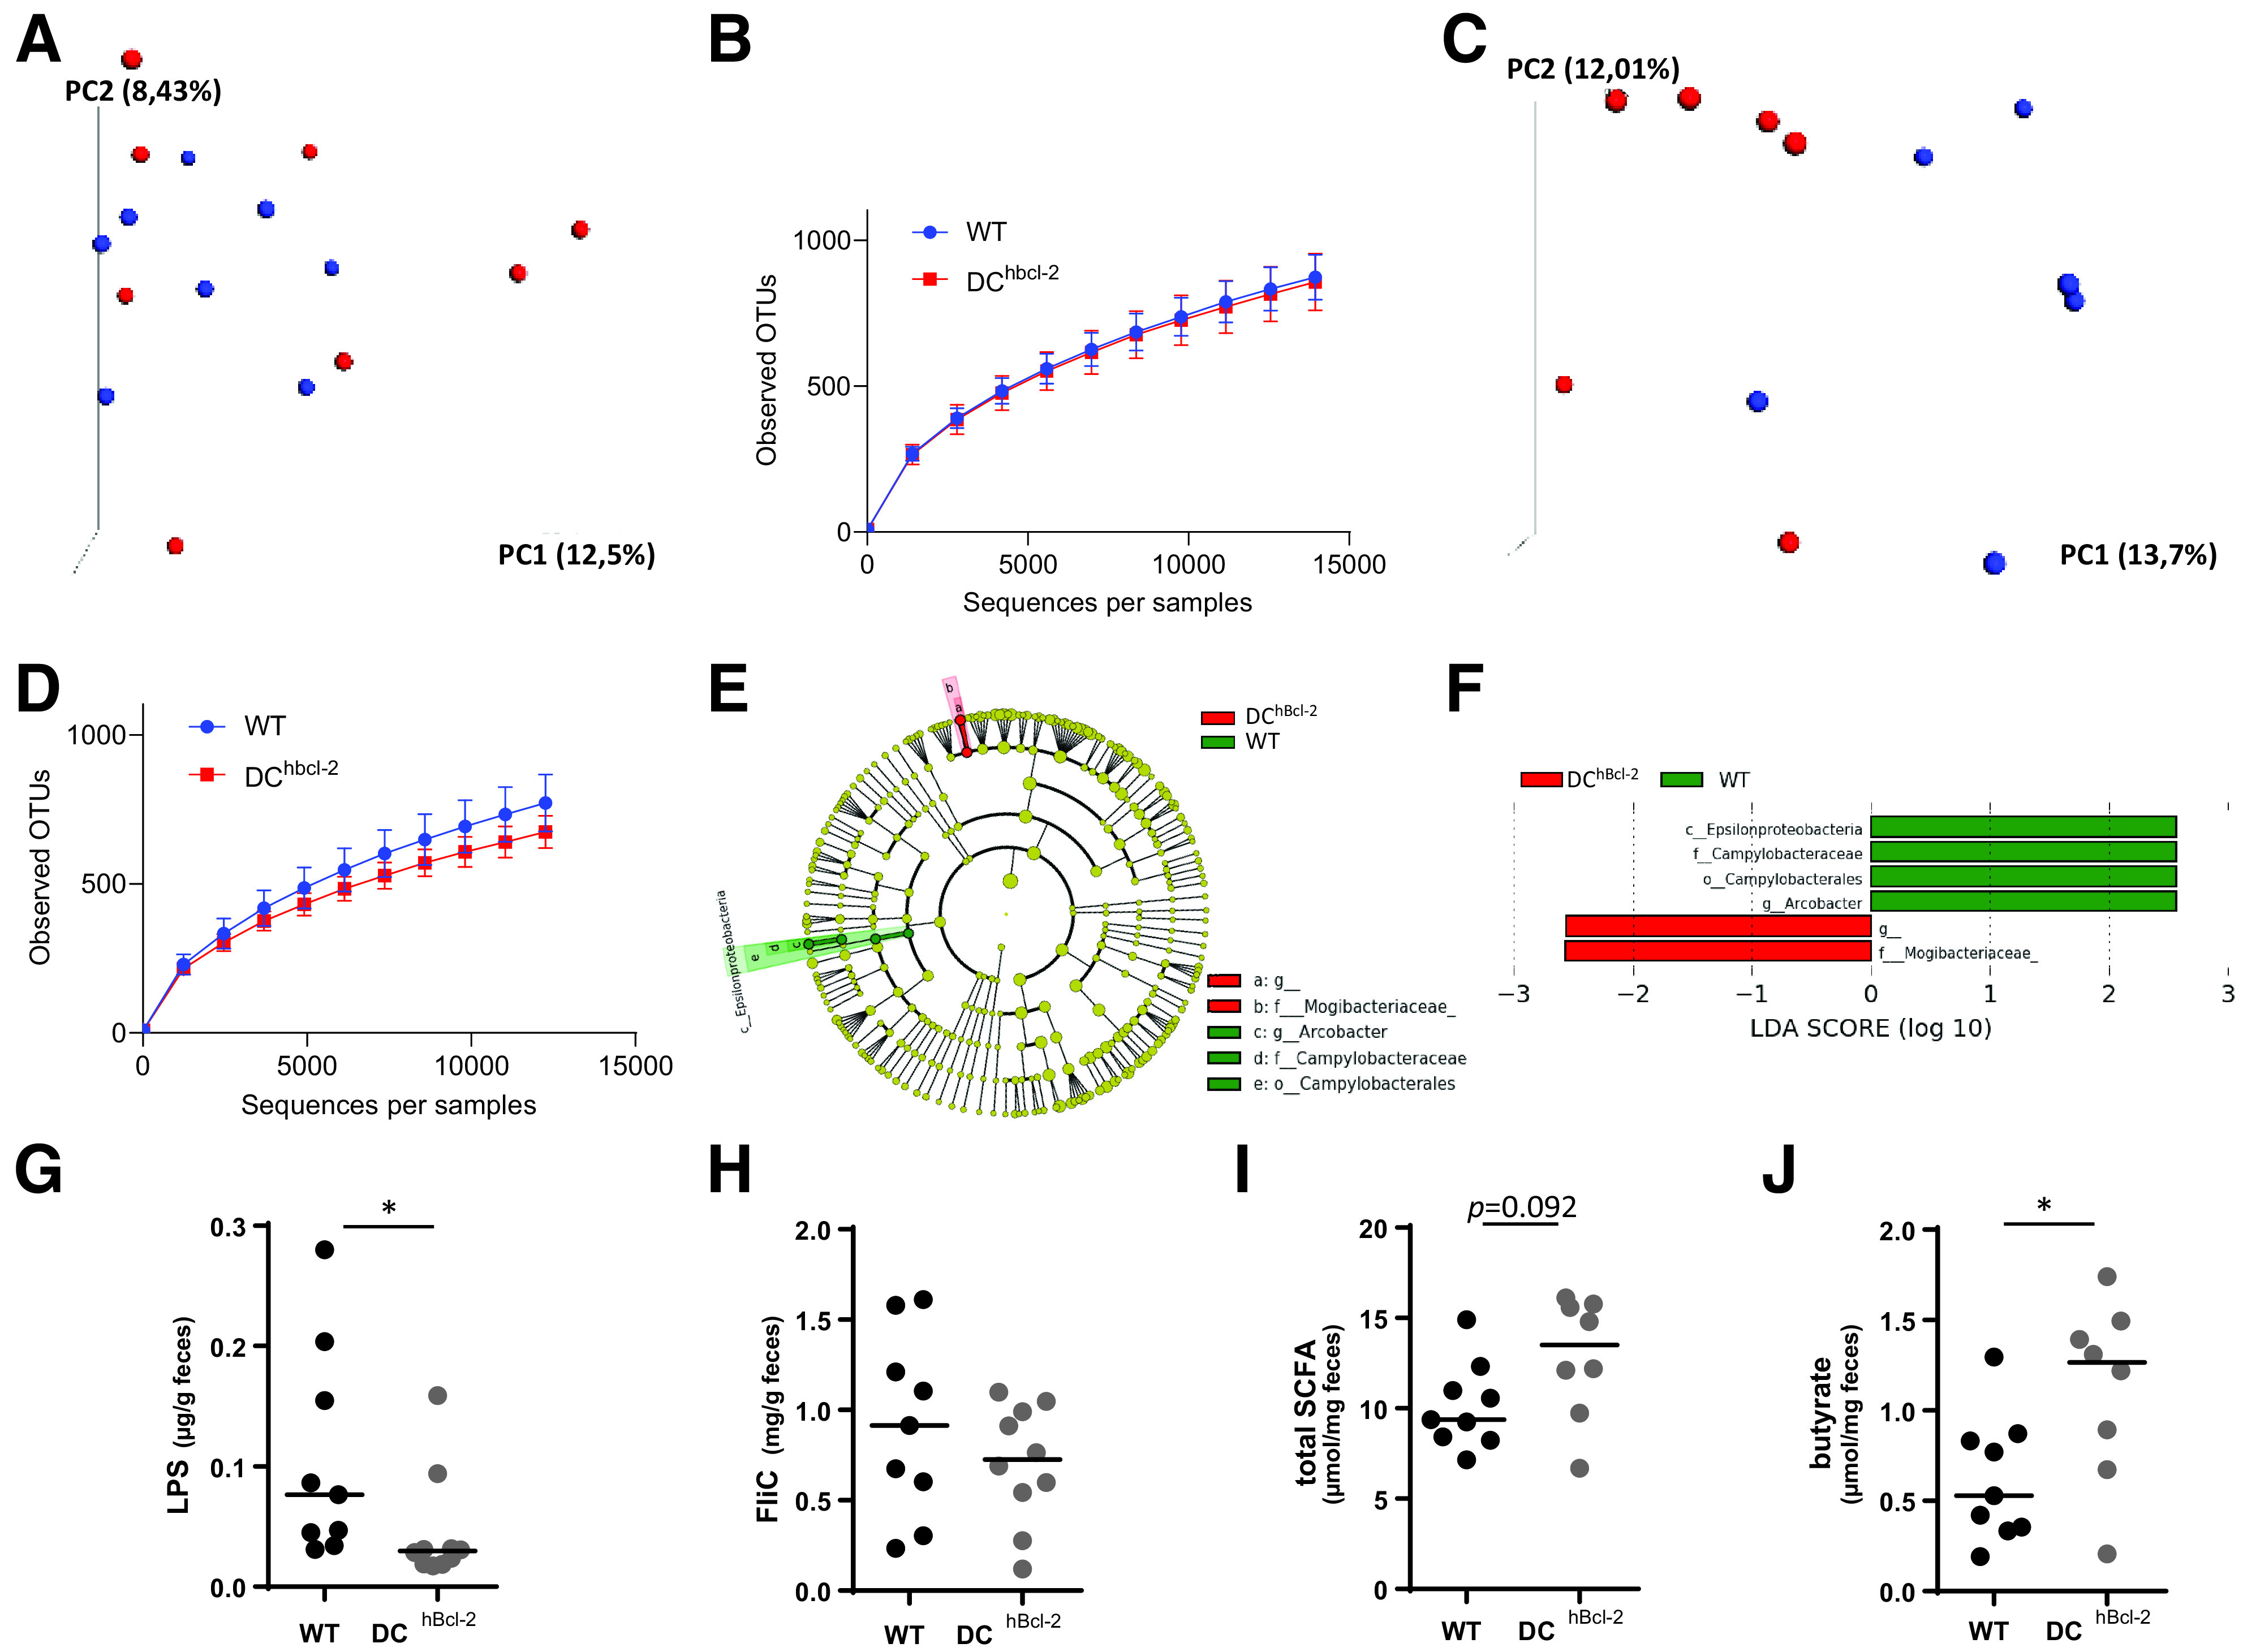
Figure 5.

HFD-fed DChBcl-2 mice shape a gut microbiota characterized by lower inflammatory signatures. Principal component (PC) analysis of the unweighted UniFrac distance matrix (A and C) and α diversity assessment (B and D) of fecal WT and DChBcl-2 microbiota at baseline (A and B) and after 12 weeks of HFD (C and D). E and F: LEfSe was used to investigate bacterial members that drive the differences between the fecal microbiota of WT and DChBcl-2 mice. E: Taxonomic cladogram obtained from LEfSe analysis. Red indicates taxa significantly more abundant in WT mice; green indicates taxa significantly more abundant in DChBcl-2 mice. F: LDA scores for the differentially altered taxa. Green indicates taxa significantly more abundant in WT mice; red indicates taxa significantly more abundant in DChBcl-2 mice. Only taxa meeting an LDA significance threshold >2.0 are presented. G and H: Fecal LPS and FliC levels in WT and DChBcl-2 mice assessed by HEK reporter cell lines. Fecal total SCFA (I) and fecal butyrate concentrations (J) in WT and DChBcl-2 mice. Data are represented as median for dot plots. OTU, operational taxonomic unit. *P < 0.05.
