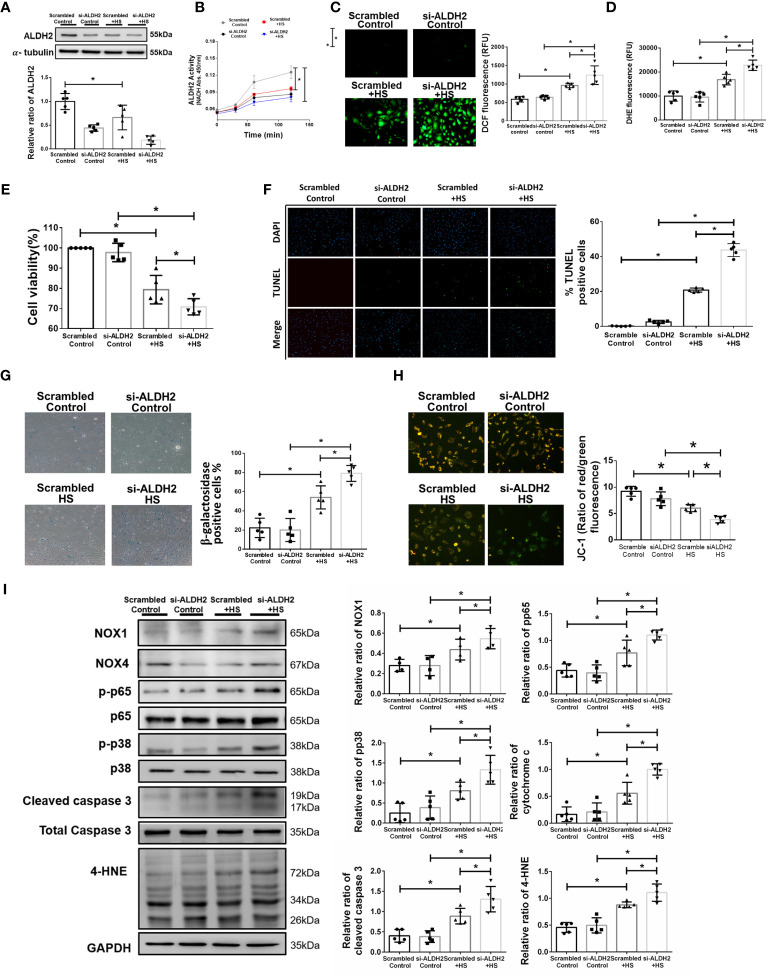
Figure 2.
Silencing ALDH2 augmented heat stress-induced activation of NF-κB, ROS production and apoptosis in HUVECs in vitro. HUVECs were transfected with ALDH2 siRNA or control siRNA (scramble) before heat stress induction (42°C for 2 h). (A) ALDH2 protein expression was measured by immunoblotting (n = 5). (B) The ALDH2 activity in cell lysate was determined by measuring NADH production based on the O.D. absorbance at 450 nm in a microplate reader (n = 5). (C) Measurement of ROS production based on DCF fluorescence using a fluorescence microplate reader with an excitation wavelength of 488 nm and an emission wavelength of 535 nm (n = 5). (D) Measurement of cellular ROS production based on DHE fluorescence using a fluorescence microplate reader with an excitation wavelength of 518 nm and an emission wavelength of 606 nm (n = 5). (E) The viability of HUVECs was measured by the MTT assay based on the O.D. absorbance at 570 nm in a microplate reader (n = 5). (F) The levels of apoptosis were measured by the TUNEL assay as determined fluorescence microscopy. The percentage of apoptotic cells was determined based on the number of TUNEL-positive cells among the total number of cells (n = 5). (G) The levels of senescence were measured by β-galactosidase activity detection using bright field microscopy (n = 5). (H) Detection of mitochondrial dysfunction by the JC-1 assay, revealing a decrease in the mitochondrial membrane potential (ΔΨm) in live cells as determined by fluorescence microscopy and fluorescence microplate reader. The ΔΨm level is expressed as the merge of the red and green channels, and the data were quantified as the ratio of red fluorescence intensity to the green fluorescence intensity (n = 5). (I) The protein and 4-HNE levels in lung homogenates were measured by immunoblotting. Densitometric analysis was conducted with imaging processing software. The data were quantified by normalization to GAPDH; phosphorylated proteins were normalized to total proteins (n = 5). The data are expressed as the mean ± SD. Statistical significance is indicated as *p < 0.05.

