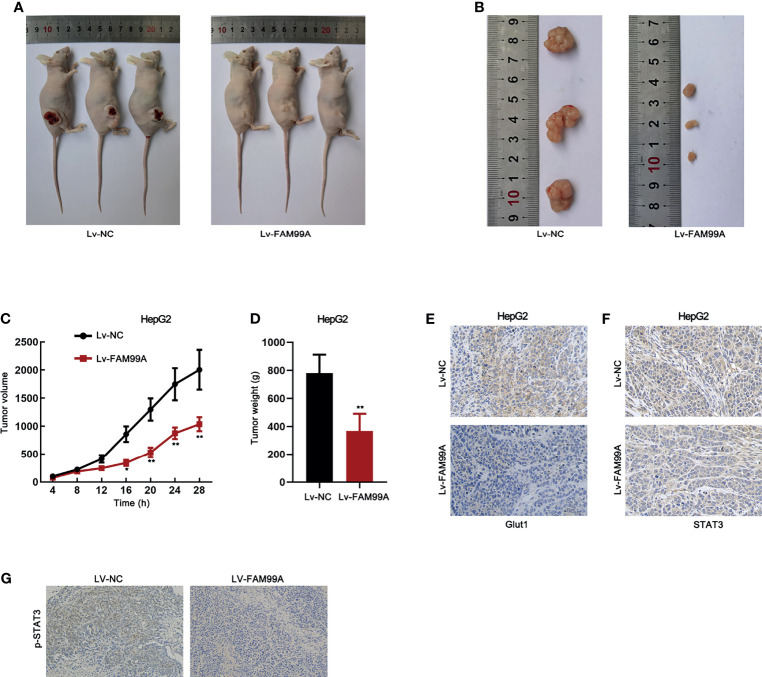
Figure 8.
Effect of FAM99A on HCC in a xenograft model. (A) Pictures of mice with tumors generated by injected HepG2 cells transfected with Lv-FAM99A or lv-NC. (B) Pictures of dissected xenografts of each group. (C) The growth curve of xenografts was plotted by measuring the tumor volume in mice every 4 days after injection of transfected cells. (D) Tumor weight was evaluated after the tumors were dissected after 28 days. (E) The expression of GLUT1 in tumor tissues was detected by immunohistochemistry assay. (F) The expression and location of STAT3 in HepG2 was examined by immunohistochemistry assay. (G) The existence of p-STAT3 in tumor tissues was detected by immunohistochemistry assay. * p < 0.05, ** p < 0.01.

