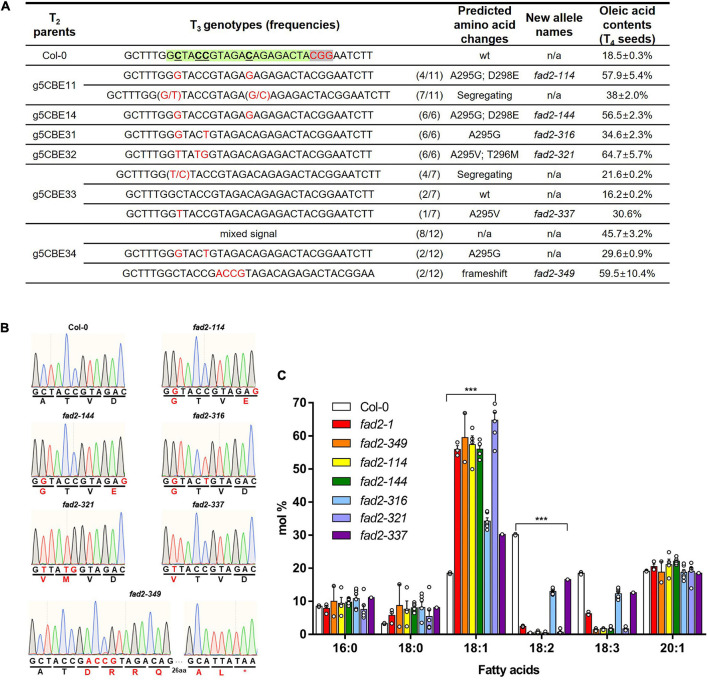
FIGURE 3.
Characterization of the base-edited fad2 alleles. (A) A summary of T3 segregation patterns and analyses of oleic acid contents depending on each genotype. Green and gray letterboxes denote protospacer sequence and PAM sequence, respectively. Red letters indicate altered DNA sequences. According to fixed genotypes, novel fad2 alleles were defined with predicted amino-acid changes. (B) Chromatogram results from Sanger sequencing for FAD2 genotyping within editing windows in the defined fad2 alleles. Red letters indicate altered DNA and amino-acid sequences. (C) Comparison of fatty acid compositions between T4 seeds from novel fad2 alleles, fad2-1, and Col-0. A one-way ANOVA statistical analysis was used to identify differences between the Col-0 and fad2 alleles (***p < 0.001). Values represent mean ± SD.

