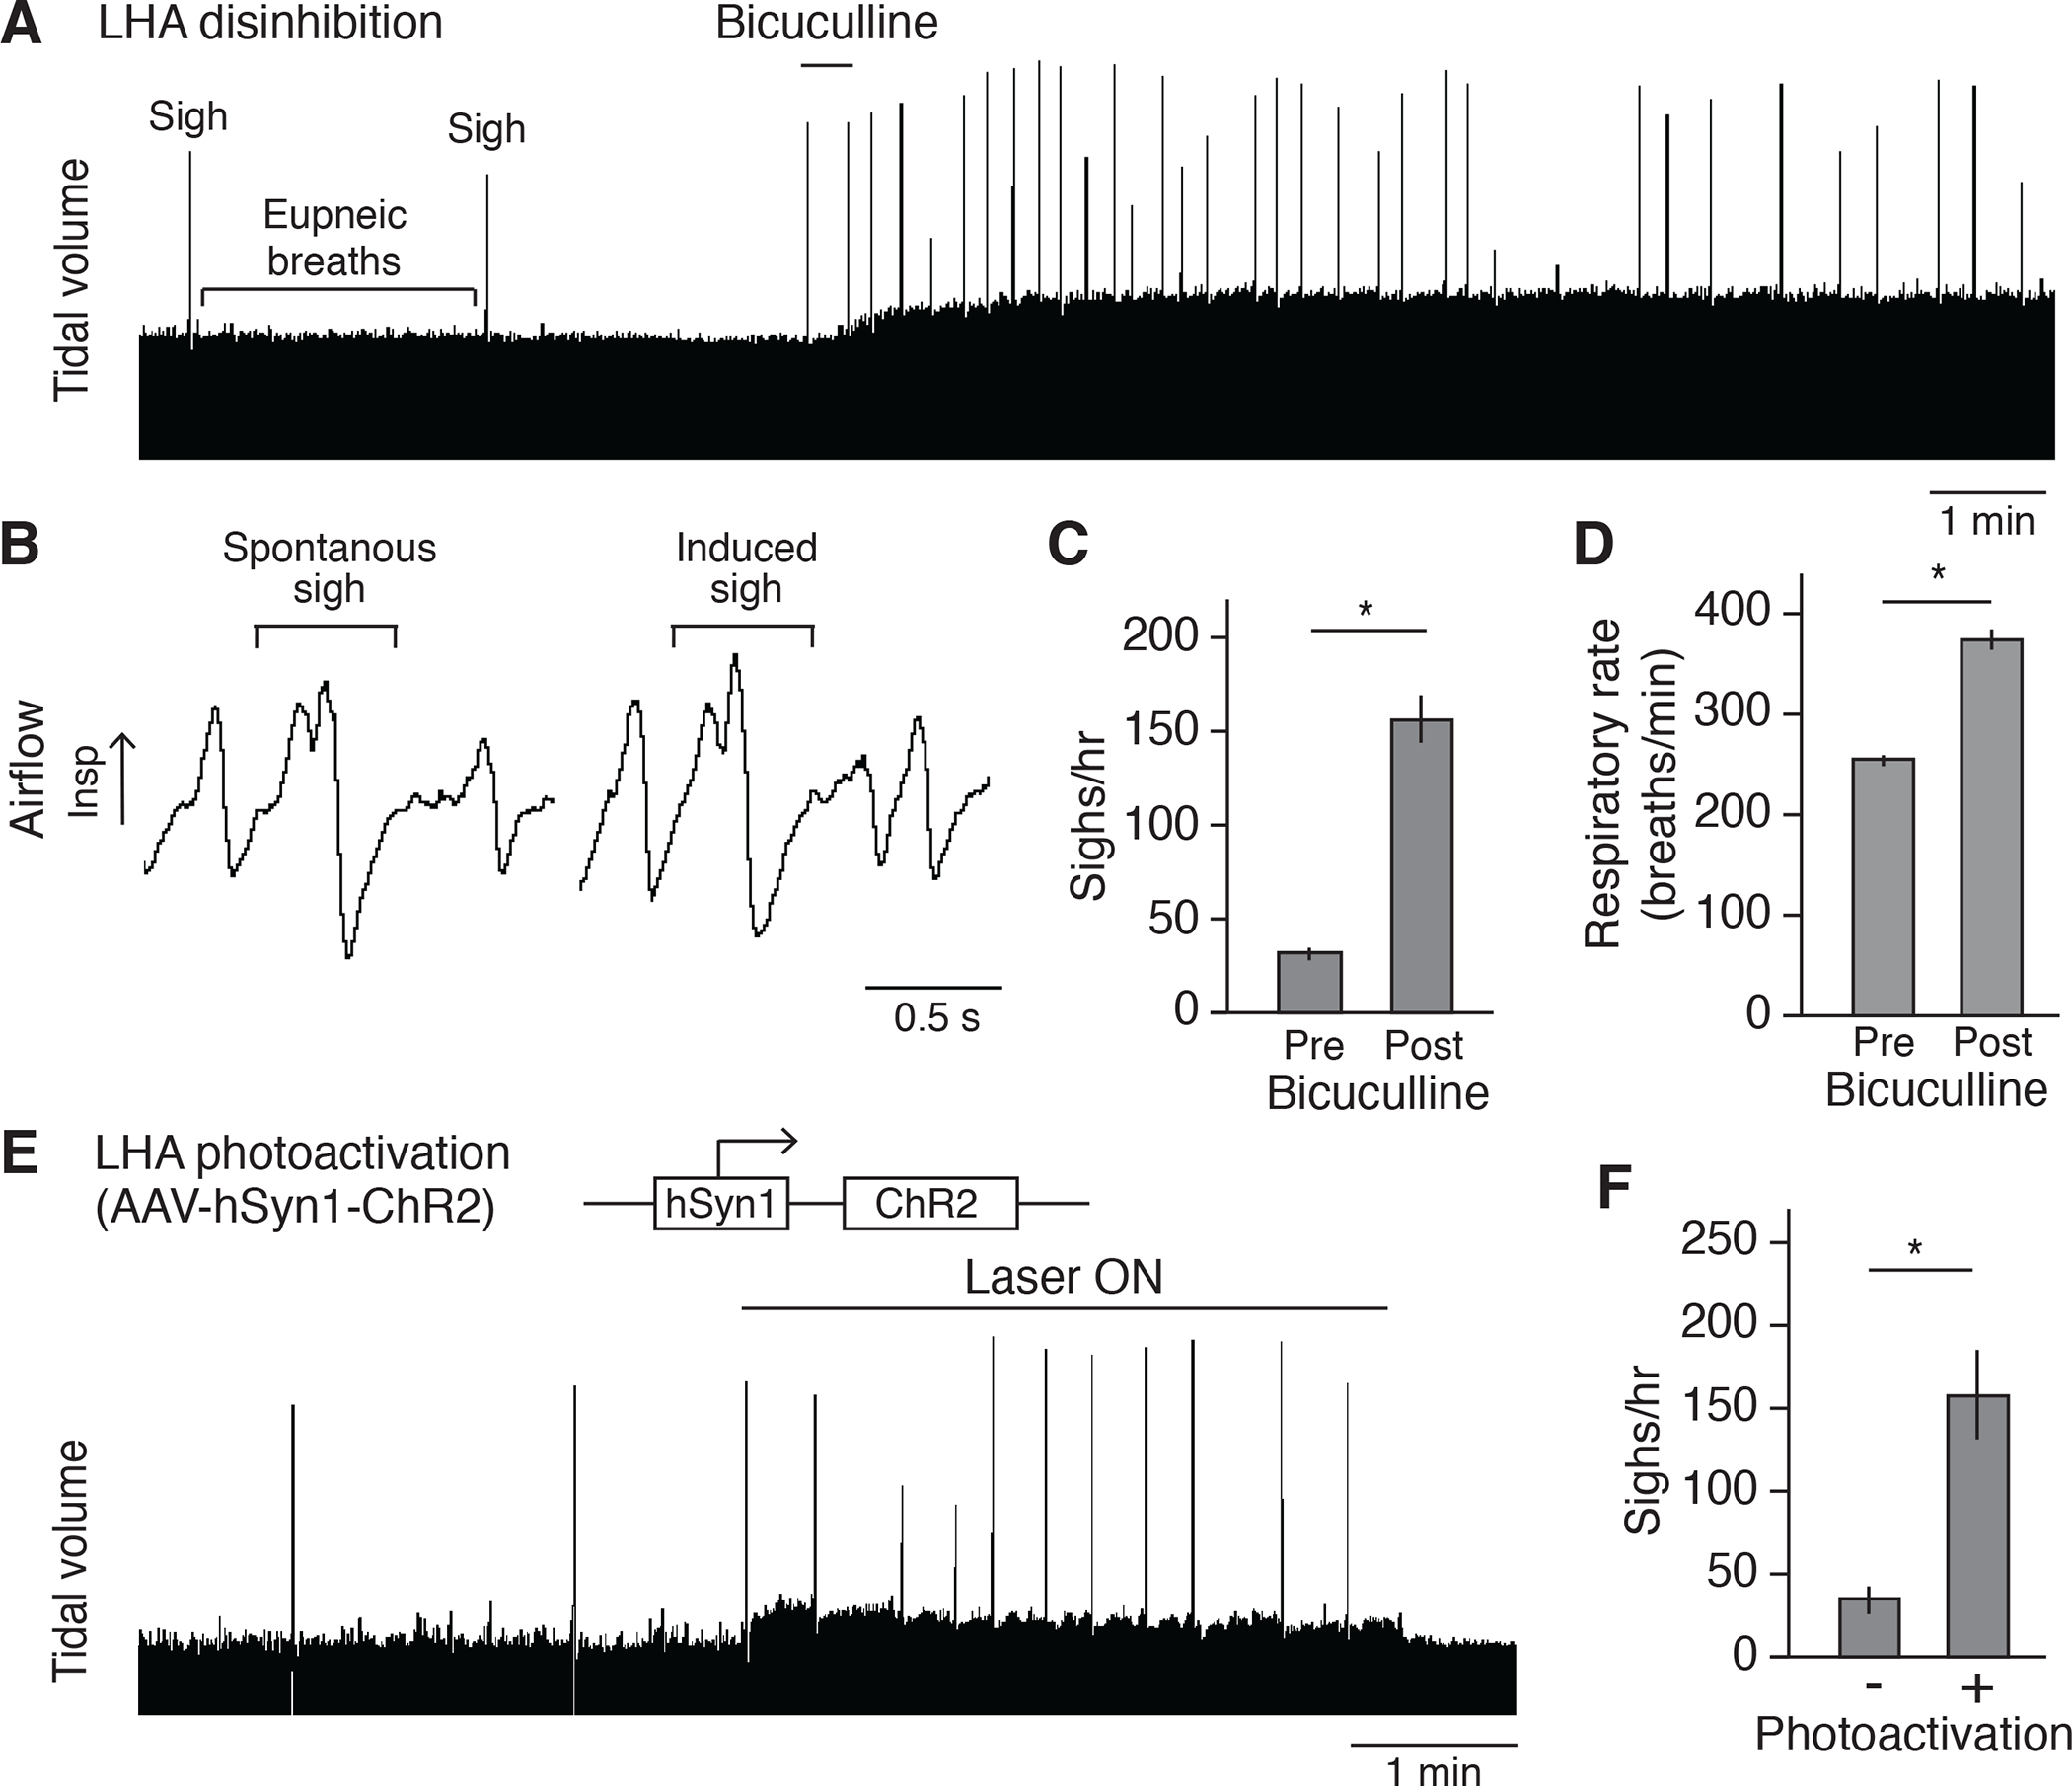
Figure 3. Activation of LHA neurons induces sighing.

(A) Respiratory trace (~15 minutes) showing respiratory activity of an anesthetized wild-type C57BL/6 mouse before and after stereotactic bicuculline injection to disinhibit LHA. Note standard (eupneic) breaths are normally punctuated every few minutes by a double-size sigh, which increase in frequency after bicuculline injection. Also note that the tidal volume is increased after disinhibition. Because the tidal volume is harder to quantify reliably for the confinement experiment in behaving animals by plethysmography, no further characterization was performed on tidal volume. Scale bar, 1 min. (B) Expanded trace segments showing similarity of sigh waveform before (spontaneous sigh) and after (induced sigh) bicuculline injection. Scale bar, 0.5 second. (C and D) Quantification showing sigh rate (C) and respiratory rate (D) of wild-type mice (n=6, mean +/−SEM) before (pre) and after (post) bicuculline injection. *, p<0.05 (paired t-test). (E) Plethysmography trace of anesthetized wild-type mouse stereotactically injected in LHA with the optogenetic AAV diagrammed 2 weeks earlier to express chanelrhodopsin ChR2, then photoactivated with fiberoptic laser at 5 Hz. (F) Quantification of sigh rate of wild-type mice with photoactivation of LHA as in e (mean +/−SEM, n=6; *, p<0.05, paired t-test).
