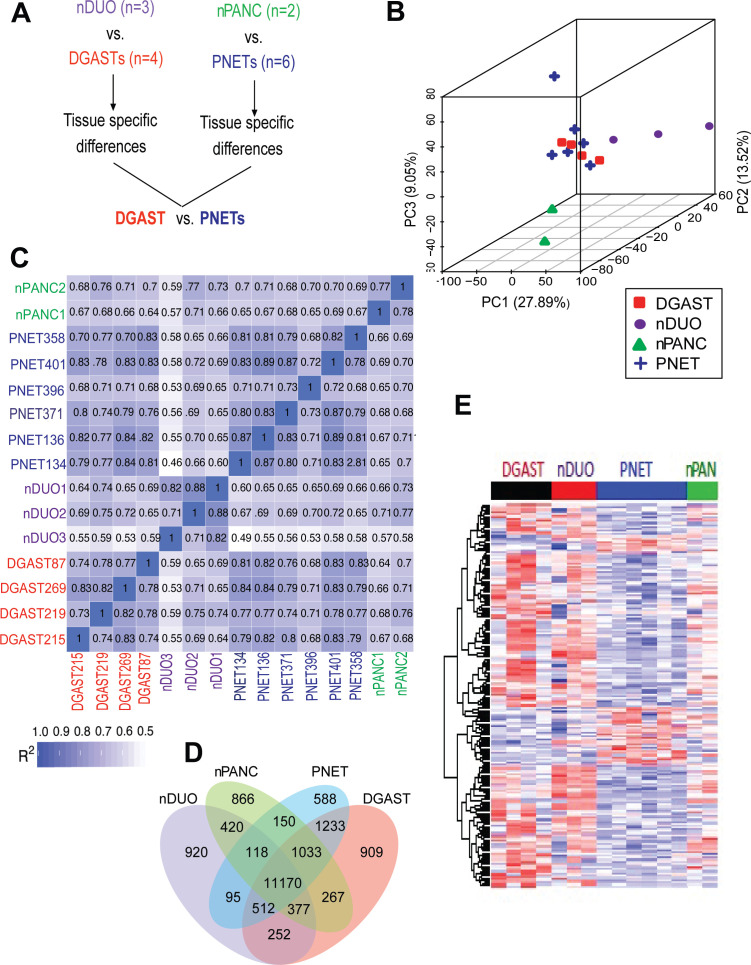
Figure 1.
Transcriptome comparison of DGAST and PNET. (A) Schematic of DGAST and PNET RNA-seq comparison. (B) PCA in three dimensions of DGAST, PNET, nDUO and nPANC. (C) Pearson’s correlation coefficients (R2) for each normal tissue and GEP-NETs, R2 >0.8=biological replicate. (D) Coexpression Venn diagram of patient samples, with default threshold of FPKM set to 1 in each group. (E) Heatmap of DEGs in DGAST (n=4), PNET (n=6), nDUO (n=3) and nPANC (n=2). DGAST, duodenal gastrinoma; FPKM, fragments per kilobase of transcript per million mapped reads; GEP-NETs, gastroenteropancreatic neuroendocrine tumours; nDUO, normal duodenum; nPANC, normal pancreas; PC, principal component; PCA, principal component analysis; PNET, pancreatic neuroendocrine tumour; RNA-seq, RNA-sequencing.

