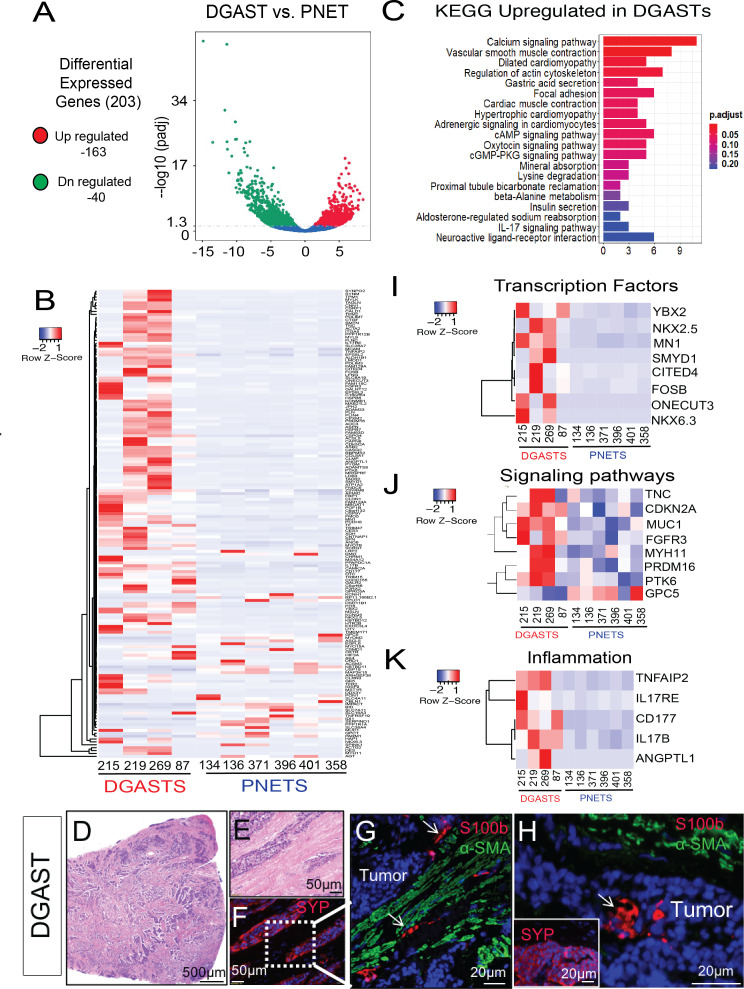
Figure 3.
DGAST shows distinct gene expression compared with PNET. (A) Volcano plot of 203 DEGs in DGAST versus PNET. (B) Heatmap of DGAST versus PNET genes clustered according to significance (p<0.05). Columns and rows were clustered by Z-transformation and Euclidean distance. (C) KEGG pathway enrichment analysis of genes upregulated in DGAST versus PNET. (D) H&E of a DGAST tumour (20×). (E) Magnified H&E of tumour clusters intercalated between thickened stroma. (F) IF with neuroendocrine marker synaptophysin (SYP, red). (G) IF of SYP+ tumour (labelled) stained with enteric glial marker S100B (white arrow, red) and mesenchymal marker α-smooth muscle actin (α-SMA, green). (H) IF of stromal markers showing S100B within DGAST tumour (white arrow). Inset shows IF for SYP staining the tumour. Nuclear stain: DAPI (blue). Genes from (B) organised into heatmaps of (I) transcription factors, (J) signalling pathways or (K) inflammation-related genes upregulated in DGAST versus PNET. DEGs, differentially expressed genes; DGAST, duodenal gastrinoma; IF, immunofluorescence; KEGG, Kyoto Encyclopedia of Genes and Genomes; PNET, pancreatic neuroendocrine tumour. DN-regulated, down-regulated. cAMP, cyclic adenosine monophosphate; cGMP-PKG, cyclic guanosine monophosphate-protein kinase G.

