
Figure 5.
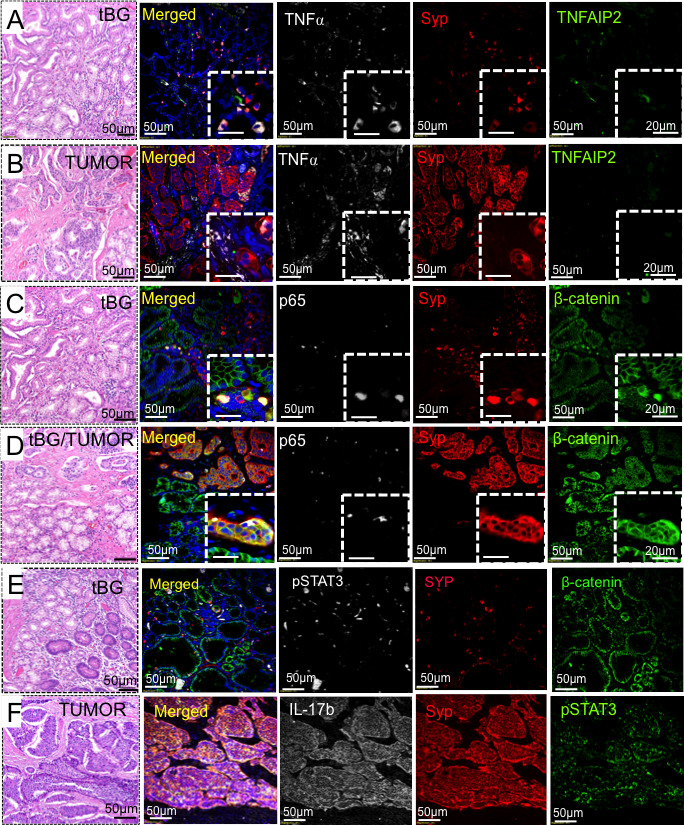
Immunofluorescent detection of TNFAIP2, NFκB and pSTAT3. Immunofluorescence analysis of known signalling targets in tBG versus the DGAST tumour for (A and B) TNFα (white), SYP (red) and TNFAIP2 (green); (C and D) p65 (white), SYP (red) and β-catenin (green); (E) tBG: pSTAT3 (white), SYP (red) and β-catenin (green); and (F) tumour: IL-17b (white), SYP (red) and pSTAT3 (green). DGAST, duodenal gastrinoma; SYP, synaptophysin; tBG, tumour-associated Brunner’s glands.