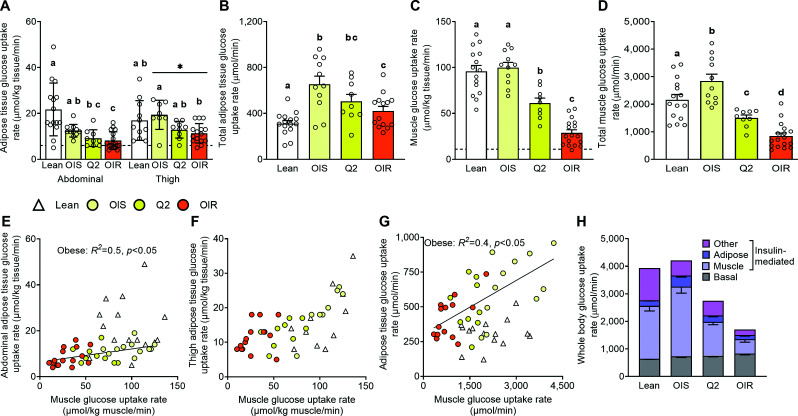
Figure 1.
SAT, skeletal muscle, and total whole-body glucose uptake rates. Insulin-stimulated glucose uptake rate per kilogram of abdominal and thigh SAT (A), total insulin-stimulated adipose tissue glucose uptake rate (B), average insulin-stimulated glucose uptake in skeletal muscles per kilogram of muscle (C), total insulin-stimulated skeletal muscle glucose uptake rate (D), relationship between insulin-stimulated glucose uptake rates in muscle and abdominal SAT (E), relationship between insulin-stimulated glucose uptake rates in muscle and thigh SAT (F), relationship between total insulin-stimulated glucose uptake in SAT and skeletal muscles (G), and biodistribution of insulin-stimulated whole-body glucose uptake rate, which consists of basal (non–insulin stimulated) and insulin-mediated (increase above basal) glucose uptake rate (H), in healthy lean participants and participants with obesity who were grouped according to insulin-simulated whole-body glucose uptake rate. The broken horizontal lines in A and C indicate average basal tissue glucose uptake rates. Values are mean ± SEM (upward error bar only) or median (IQR). ANOVA was used to evaluate differences in outcome variables among groups in A–D. Skewed data sets were log transformed to achieve normal distribution before analysis. Regression analysis was used to evaluate the relationships between outcome variables in panels E–G. Bars not sharing letters are different from each other, P < 0.05. *Main effect of site (thigh vs. abdomen, P < 0.05). OIR, obese insulin-resistant (Q3/4); OIS, obese insulin-sensitive (Q1).

