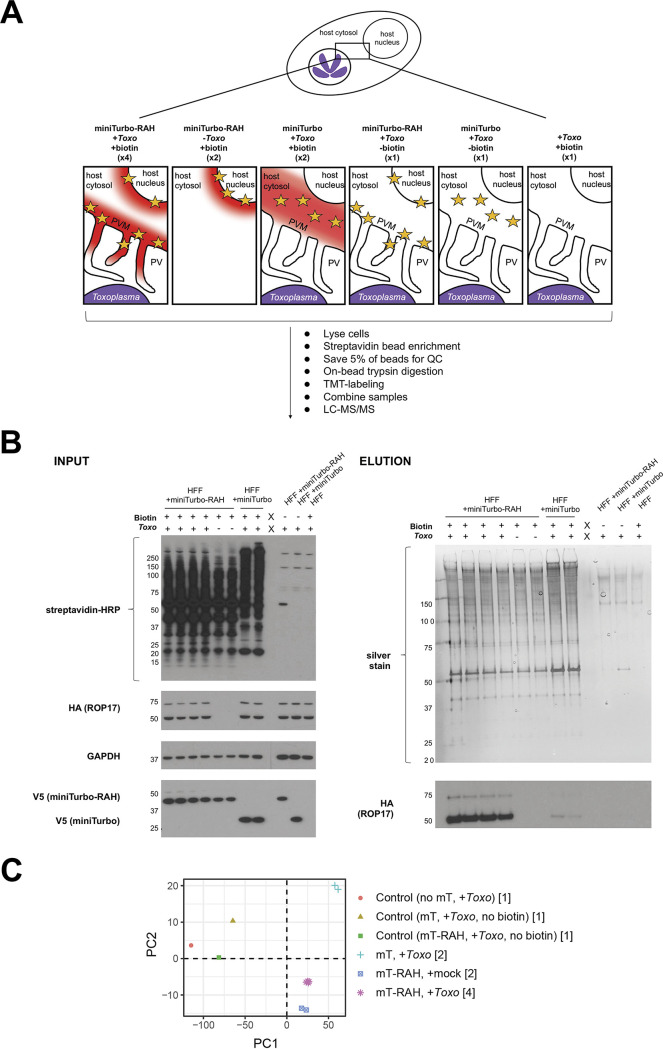
FIG 4.
Quantitative mass spectrometry-based proteomic experimental setup and quality control checks. (A) Overview of proteomics experimental design and cartoon depiction of expected regions of biotinylation (depicted by red cloud) near the Toxoplasma PVM based on miniTurbo fusion localization (yellow star) and +/– biotin in the 11 samples submitted for LC/MS-MS. The number of replicates for each sample is indicated in parentheses below the description. The indicated samples were infected with RHΔrop17::ROP17-3xHA parasites for 22 h and then treated with 50 μM biotin for 1 h. After treatment and biotin-labeling, cells were lysed, and biotinylated proteins were enriched with streptavidin magnetic beads; 5% of the beads were saved for a quality control check, the remaining protein was digested on-bead, and subsequent peptides were conjugated to TMT labels. All 11 samples were then combined and analyzed by LC-MS/MS. (B, INPUT) Western blot of whole-cell lysates. A sample of each whole-cell lysate depicted in panel A was run on an SDS-PAGE gel and blotted with streptavidin-HRP to visualize all biotinylated proteins, mouse anti-HA-HRP antibodies to visualize endogenous ROP17, and mouse anti-V5 antibodies to visualize miniTurbo expression. (ELUTION) Silver stain and Western blots of eluates from streptavidin affinity purification (from the 5% of beads saved prior to on-bead digestion). The beads were washed and proteins eluted from the beads by boiling in the presence of 2 mM biotin and BME. Equivalent volumes of each elution were run on an SDS-PAGE gel and stained with silver to visualize total protein material eluted from the beads. Equivalent volumes of each elution were additionally run on a separate SDS-PAGE gel and blotted with mouse anti-HA-HRP antibodies to check for specific enrichment of endogenous ROP17 in the PVM-miniTurbo localized samples (miniTurbo-RAH + Toxo, lanes 1–4). Approximate migration of a ladder of size standards (sizes in kDa) is indicated. (C) Principal-component analysis of the 11 samples analyzed in the proteomics experiment. Numbers in square brackets indicate the number of replicates for each sample type analyzed, as described in panel A.

