
FIG 8.
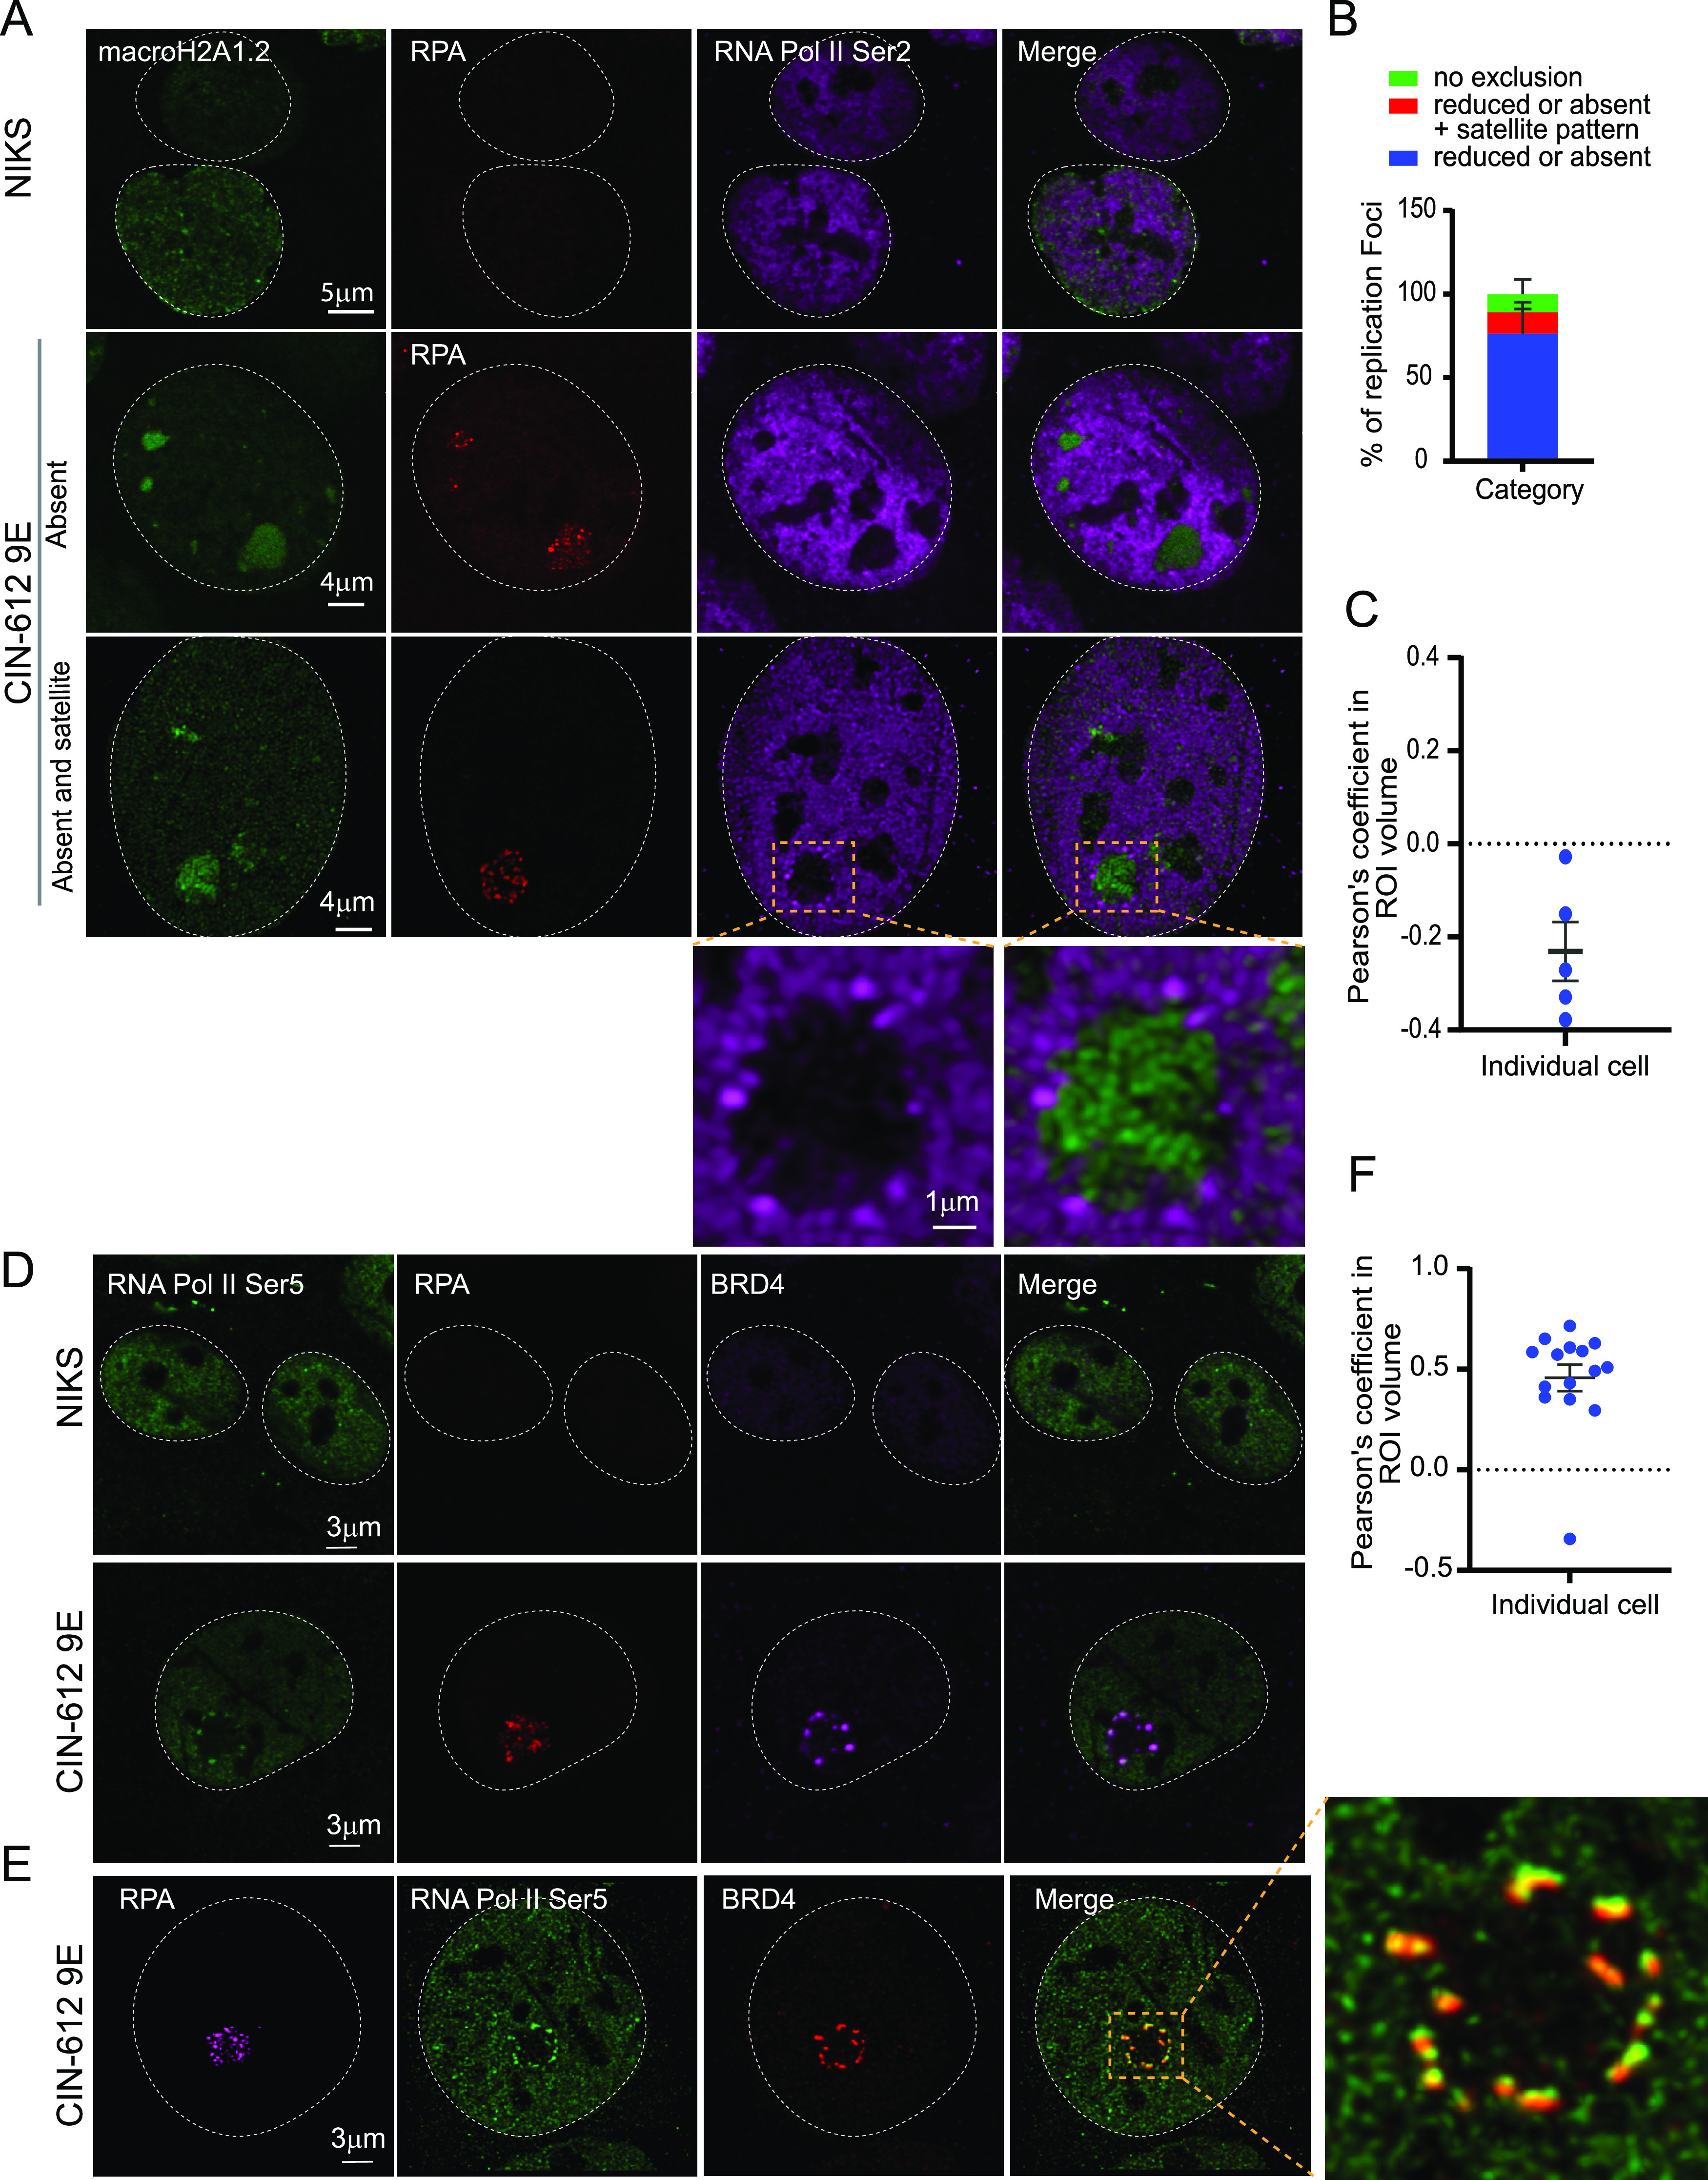
RNA Pol II Ser 2 is located outside the HPV31 replication foci in 9E cells. (A) Differentiated NIKS or 9E cells were immunostained with antibodies against macroH2A1.2 (green), RPA (red), and RNA Pol II Ser 2 (purple). A white dotted line outlines the nuclei. (B) Distribution of RNA Pol II Ser 2 at replication foci by visual counting (n = 55 cells, 130 foci) in two independent experiments. (C) Confocal images (3D) were deconvolved using Huygens Essential. Colocalization analysis was performed in an ROI (region of interest) defined by the RPA signal in Imaris (version 9.6.0). The percentage of ROI macroH2A1.2 and percentage of ROI RNA Pol II Ser 2 colocalized were calculated, and the Pearson’s coefficient in the ROI volume was calculated and shown. (D) Cells were immunostained with antibodies against RNA Pol II Ser 5 (green), RPA (red), Brd4 (CW152—recognizes both Brd4S and Brd4L; purple). In differentiated CIN-612 9E cells, 233 foci in 71 cells (n = 71) were counted using RPA as a marker for viral replication foci. A total of 34 cells were scored for differentiated NIKS as a negative control. A white dotted line marks the nuclei. (E) A high-resolution image generated from deconvolved Z stacks collected throughout the nucleus. A single slice is shown, representing the colocalization of Brd4 and RNA Pol II Ser 5 at the periphery of a viral replication foci. The magnified box demonstrates Pol II Ser 5 and Brd4 localization at viral foci. (F) Confocal images (3D) were deconvolved using Huygens Essential, and colocalization analysis was performed in the replication foci ROI defined by the RPA signal using Imaris from a total of 15 cells (n = 15, foci = 41). The percentage of ROI Brd4 and percentage of ROI Pol II Ser 5 colocalized were calculated, and the Pearson’s coefficients in the ROI volumes are shown.