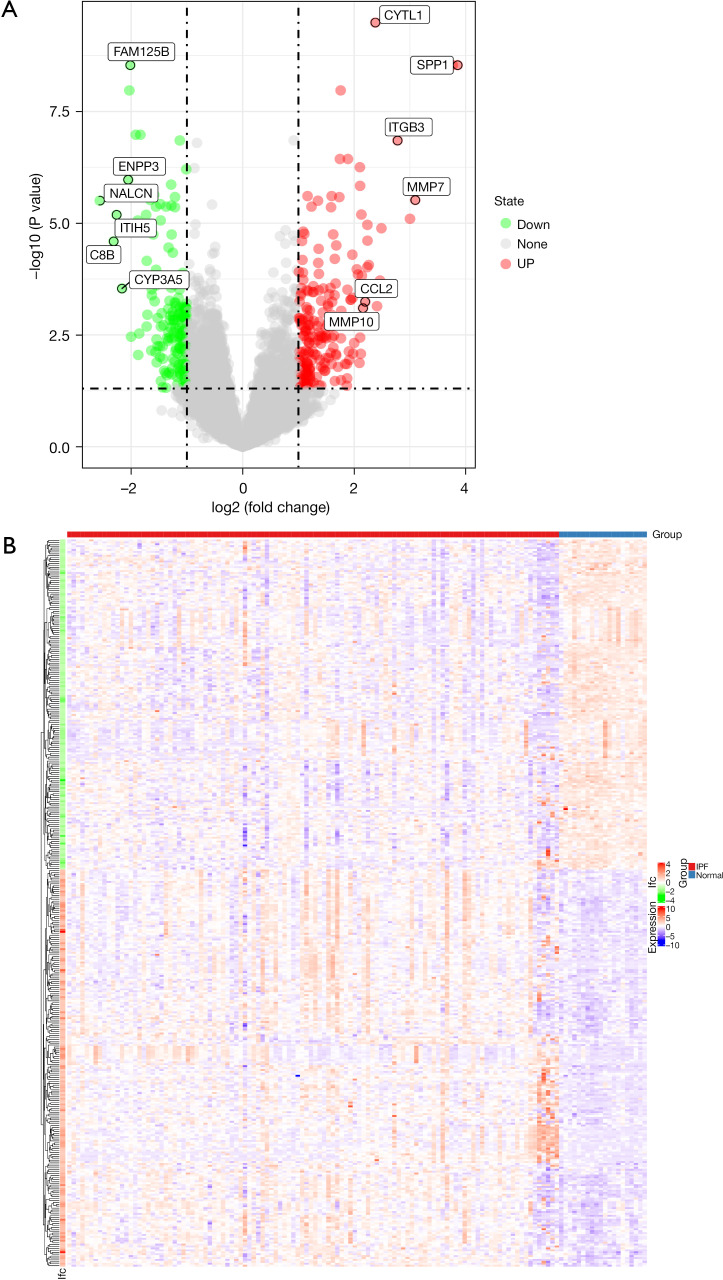
Figure 1.
Comparison of the gene expression profile between the IPF group and the healthy individuals group. (A) Heatmap of significantly DEGs. (B) Volcano map of DEGs; red dots represent upregulated DEGs, grey dots represent non-differentially expressed genes, and green dots represent downregulated DEGs. IPF, idiopathic pulmonary fibrosis; DEGs, differentially-expressed genes.

