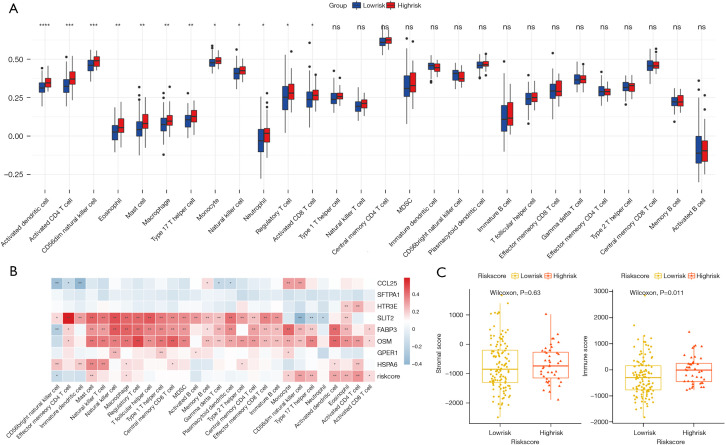
Figure 10.
Characteristics of infiltrating immune cells between high and-low risk groups. (A) Differences in the abundance of immune cells in the two groups (*, P<0.05; **, P<0.01; ***, P<0.001; ****, P<0.0001; ns, not significant); (B) correlation of immune cells and genes of signature (*, P<0.05; **, P<0.01); (C) differences between the two groups in the two immune scores.

