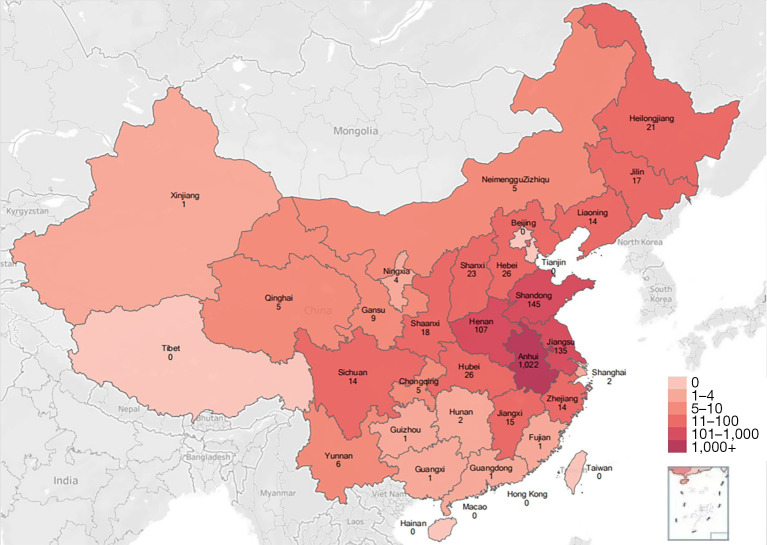
Figure 3.
Distribution of subjects’ residences. A heat map was used to describe the concentration of the residence locations of subjects who participated in trial screenings and to understand the relationship between the distance from the place of residence to the institution and the screening failure rate.

