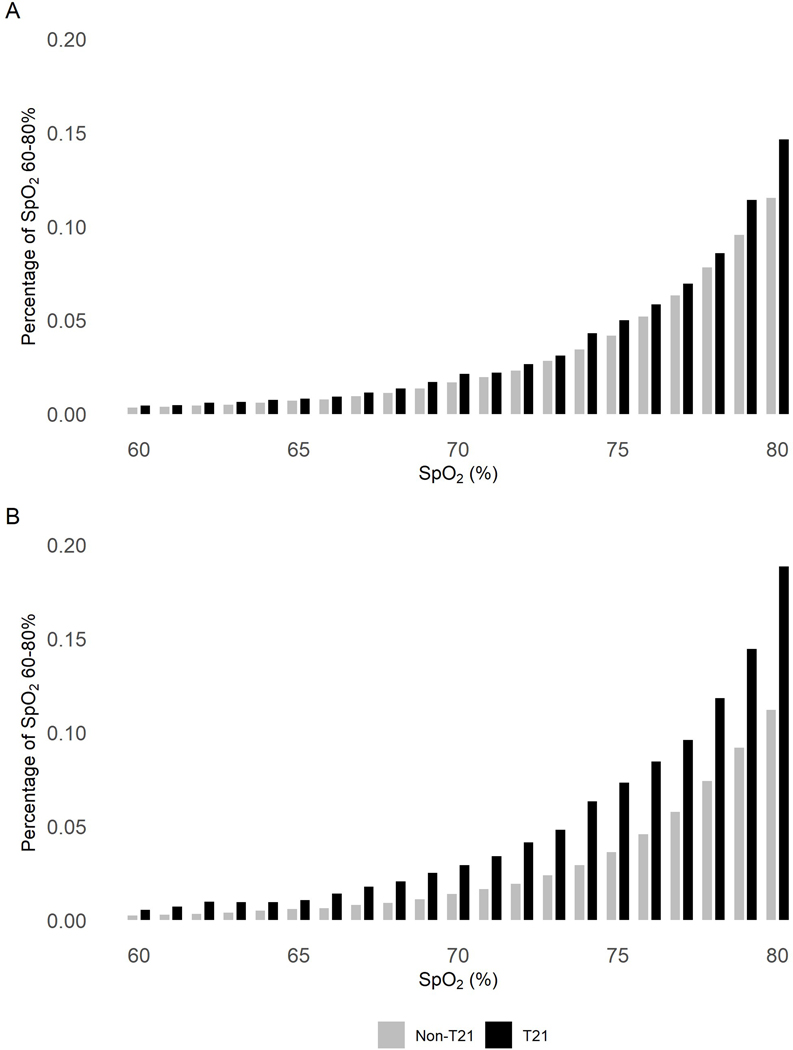
Figure 2: Distribution of all SpO2 values 60–80%.
Pulse oximeter SpO2 values measured every 2 seconds were analyzed (A) through the entire NICU stay and (B) in the final NICU week before discharge home. Rates of each SpO2 value from 60%–80% are shown, normalized by amount of data available per infant so that infants with more data points recorded are not over-represented in the distribution, for infants with T21 (black bars) or without T21 (gray bars). SpO2 data were available for 23 infants with T21 and 460 infants without T21 for the whole NICU stay, and for 22 infants with T21 and 411 infants without T21 for the final week.

