Figure 4.
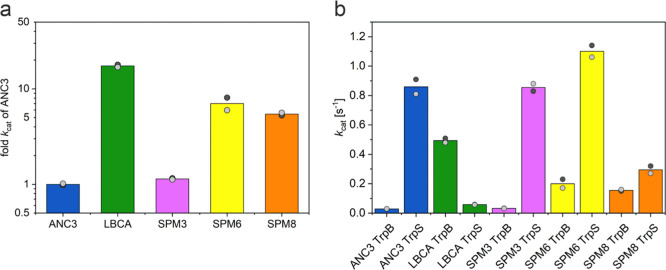
Illustration of the TrpB kinetic characterization. (a) TrpB stand-alone activities (in terms of kcat) for LBCA, SPM3, SPM6, and SPM8, shown as multiples of the ANC3 activity (logarithmic scale). While the reference stand-alone LBCA TrpB is 17.4-fold more active than ANC3 TrpB, the new TrpB designs SPM3, SPM6, and SPM8 are 1.1-fold, 7-fold, and 5.4-fold more active than ANC3 TrpB. (b) Activity differences (in terms of kcat) between isolated and TrpA-complexed ANC3, LBCA, SPM3, SPM6, and SPM8 TrpB enzymes. TrpS complex formation leads to an increase in the catalytic activities of ANC3, SPM3, SPM6, and SPM8 TrpB enzymes by factors of 30.2, 26.3, 5.5, and 1.9, and a decrease for LBCA TrpB by a factor of 8.4. The bar height represents the average value from two independent measurements, which are shown as gray dots. All catalytic constants are listed in Tables S2–S5.

