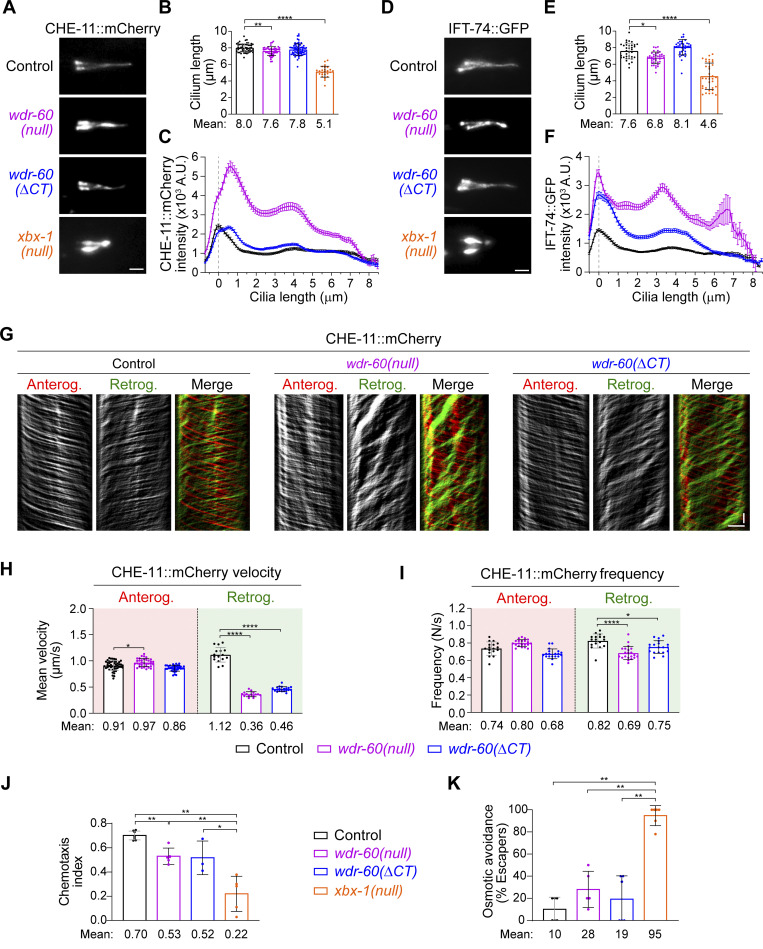
Figure 4.
wdr-60 mutants have reduced retrograde transport of IFT-A and IFT-B complexes and lower efficiency of cilia-mediated signaling. (A and D) Phasmid cilia from control, wdr-60(null), wdr-60(ΔCT), and xbx-1(null) animals expressing CHE-11::mCherry (A) or IFT-74::GFP (D). (B and E) Cilia length measured with CHE-11::mCherry (B) or IFT-74::GFP (E; n ≥ 26 and n ≥ 34 cilia, respectively). (C and F) Quantification of the average intensity of CHE-11::mCherry (C) and IFT-74::GFP (F) along cilia (n ≥ 42 and n ≥ 66 cilia, respectively). (G) CHE-11::mCherry kymographs of phasmid cilia from the indicated strains. (H) Mean velocity of CHE-11::mCherry particles moving on anterograde and retrograde tracks (n ≥ 225 particle traces were analyzed in ≥15 cilia). (I) Frequency of IFT particles detected at the distal segment of cilia (n ≥ 17 cilia). (J and K) WDR-60 is required for efficient sensory cilia functions. (J) Chemotaxis index for the attractant IA (n ≥ 450 animals tracked over ≥3 assays). (K) Osmotic avoidance assay to test whether sensory cilia detect a hypertonic glycerol barrier (n ≥ 20 animals tracked over ≥4 assays). The dynein-2 LIC xbx-1(null) strain was used for comparison. XY intensity distribution graph is shown as mean ± SEM, and graphs in columns are shown as mean ± SD. One-way ANOVA followed by Tukey’s multiple comparison were used to analyze the datasets in B, H, and I. Kruskal–Wallis test followed by Dunn’s multiple comparison were used to analyze the datasets in E. *, P ≤ 0.05; **, P ≤ 0.01; ****, P ≤ 0.0001. Scale bars: 2 µm (A and D); vertical 5 s, horizontal 2 µm (G).

