Figure 7.
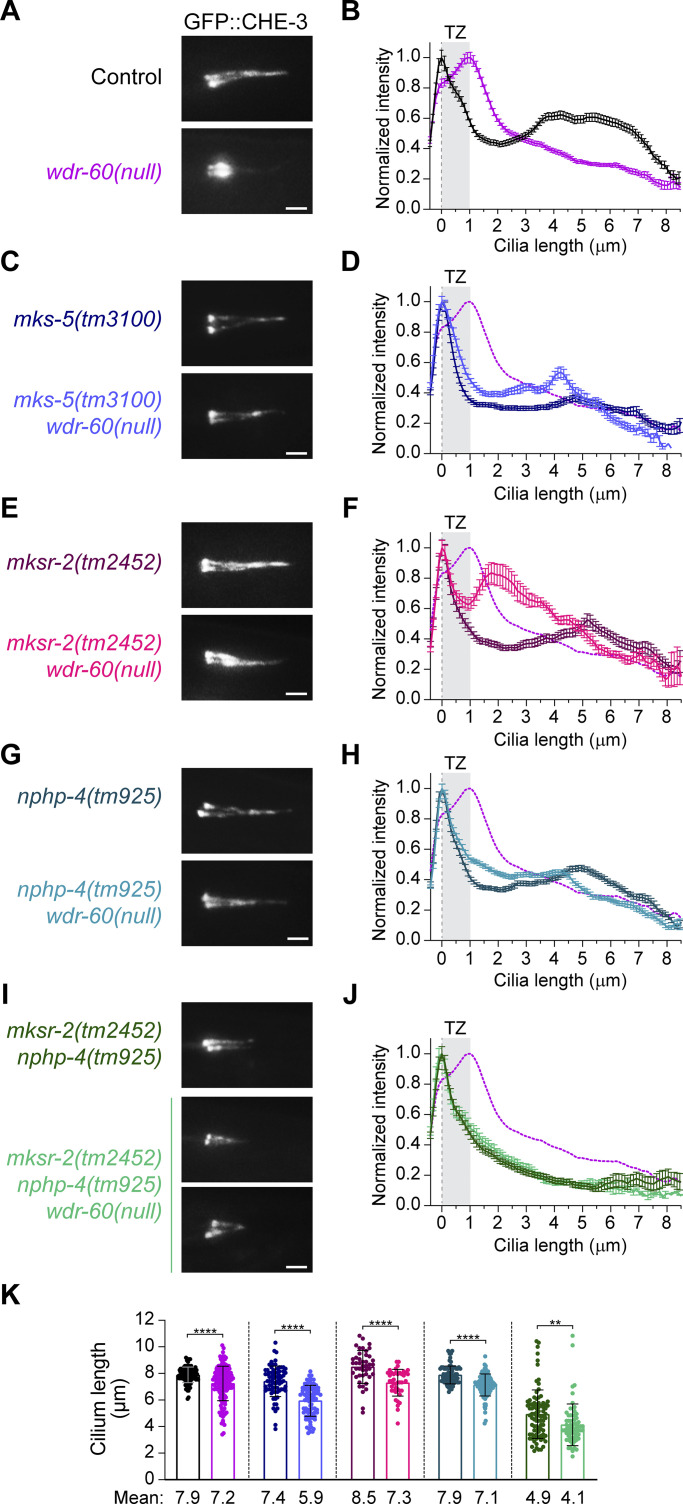
Disruption of specific TZ components rescues dynein-2 accumulation inside cilia of wdr-60 mutants. (A, C, E, G, and I) Representative examples of phasmid cilia of the indicated wdr-60 and TZ mutant genotypes, expressing GFP::CHE-3. (B, D, F, H, and J) Relative distribution of GFP::CHE-3 signal intensity along cilia. The purple dashed line represents the data from the wdr-60(null) in B. Gray rectangles highlight the TZ, as previously defined. n ≥ 108 cilia for B, n ≥ 74 cilia for D, n ≥ 42 cilia for F, n ≥ 80 cilia for H, and n ≥ 64 cilia for J. XY intensity distribution graphs are shown as mean ± SEM. (K) Length of the cilia analyzed in B, D, F, H, and J from the same color-coded genotypes indicated in A, C, E, G, and I. Loss of WDR-60 combined with TZ mutations always resulted in a slight decrease of cilia length relative to the respective TZ mutant control. Graph is shown as mean ± SD. Mann–Whitney U test was used to analyze each pair of datasets. **, P ≤ 0.01; ****, P ≤ 0.0001. Scale bars: 2 µm.

