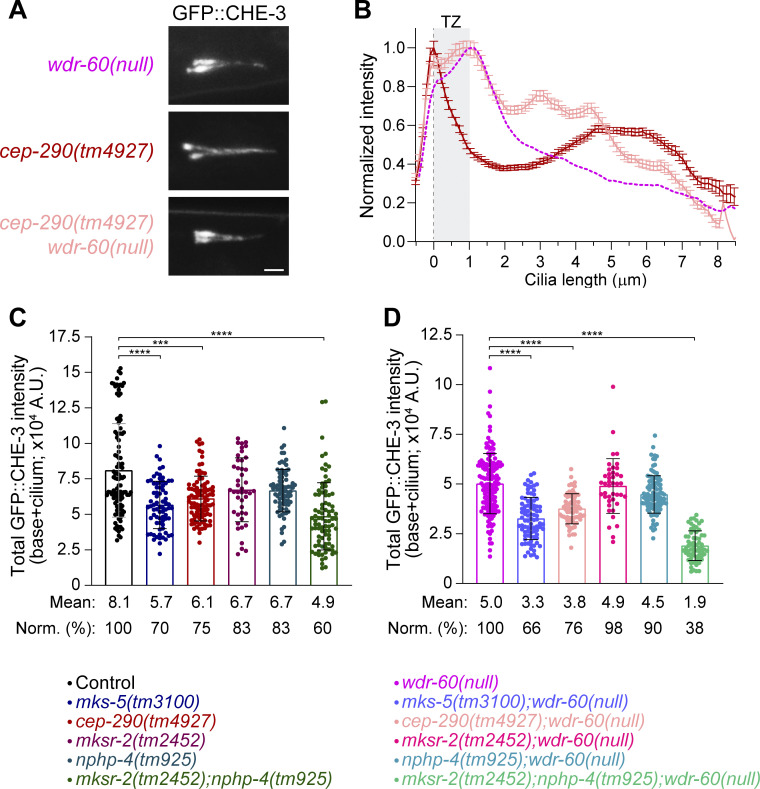
Figure S5.
Disruption of some TZ components changes the average levels of ciliary dynein-2. Related to Fig. 7. (A) Phasmid cilia of the indicated wdr-60 and cep-290 mutant genotypes, expressing GFP::CHE-3. Scale bar: 2 µm. (B) Distribution of GFP::CHE-3 signal intensity along cilia from the strains in A (n ≥ 74 cilia). The gray rectangle highlights the TZ, as previously defined. XY intensity distribution graph is shown as mean ± SEM. (C and D) Total GFP::CHE-3 intensity from the base to the tip of cilia from TZ mutants of the indicated genotypes, in wild-type wdr-60 (C) and wdr-60(null) mutant (D) backgrounds. The cilia quantified here correspond to the same that were used to quantify the GFP::CHE-3 distribution profiles depicted in Fig. 7. Column graphs are shown as mean ± SD. Kruskal–Wallis test followed by Dunn’s multiple comparison were used to analyze these datasets. ***, P ≤ 0.001; ****, P ≤ 0.0001.

