
Table 1.
Comparative analysis of metabolite profiles during interspecific interactions between T. coccinea–T. versicolor
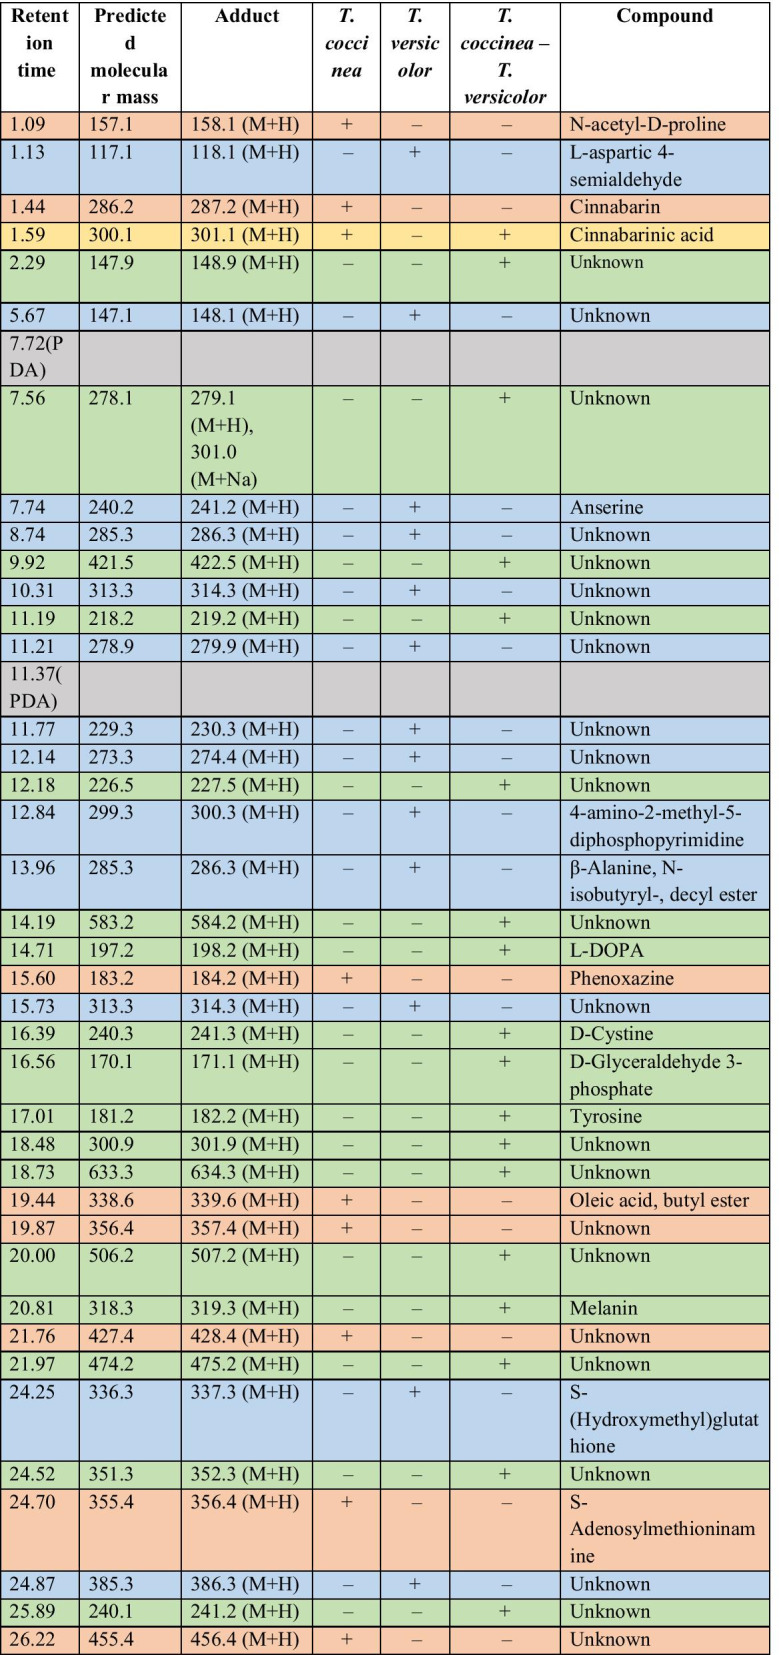
The ‘+’ sign indicates presence and the ‘−’ sign indicates absence of a particular compound. The orange-coloured cells are for the compounds produced exclusively by T. coccinea; the blue-coloured cells are for the compounds produced exclusively by T. versicolor; the yellow-coloured cells are for the compounds present in either or both the monocultures and in the interaction zone, the green-coloured cells are for the compounds produced exclusively in the interaction zone; the grey-coloured cells are for the components of PDA that has been omitted for analysis