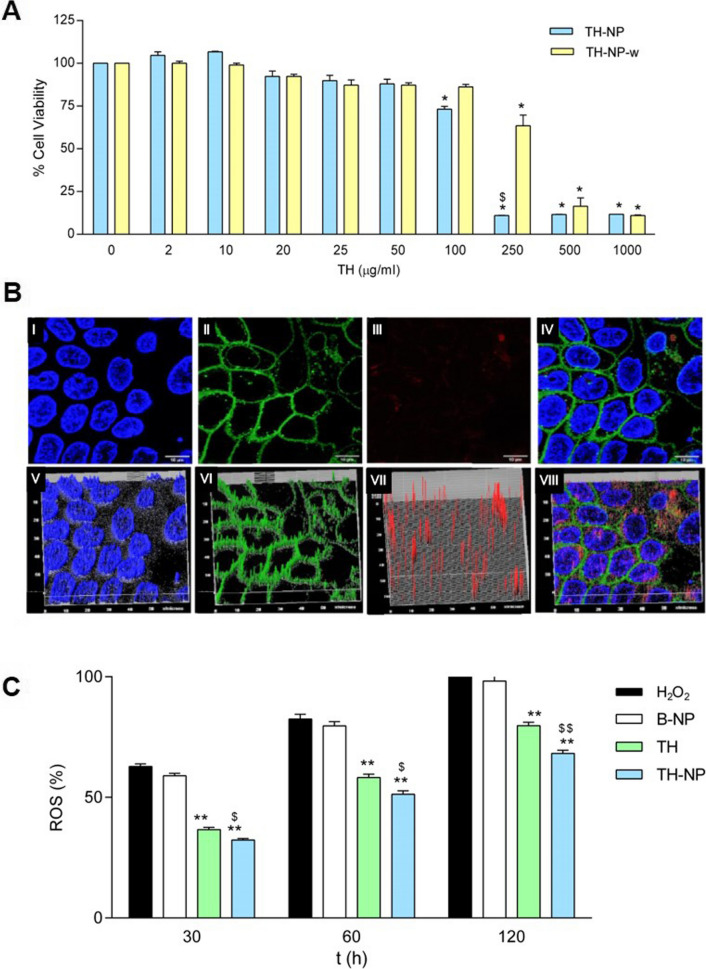
Fig. 4.
A Cell viability of HaCaT keratinocytes after incubation for 24 h with TH-NP and the washed NPs (TH-NP-w) at different concentrations. Cell viability was assayed by the MTT reduction method; 100% viability was set with the values obtained with the untreated control cells. Values represent the Mean ± SD (n = 3). Statistical analysis one-way ANOVA Tukey ‘s Multiple Comparison Test, *p < 0.01 versus control and $p < 0.01 versus TH-NP-w, B Confocal microscopy analysis of HaCaT cells incubated with R-TH-NP: (I) nuclei; (II) membranes; (III) R-TH-NP; (IV) merged (I), (II), and (III), respectively; (V–VIII-h) 3D-plot of (I)-(IV), respectively, C Time course analysis of ROS production induced by H2O2 (2 mM) in HaCaT cells treated with TH or TH-NP. The ROS production (100%) was set with the values obtained with cells challenged with H2O2 for 2 h. Data were expressed (%) as the Mean ± SD (n = 8). Statistical analysis was performed by one-way ANOVA Tukey’s Multiple Comparison Test, **p < 0.001 versus controls at 2 h; $p < 0.05 and $$p < 0.001 between TH and TH-NP treated cells

