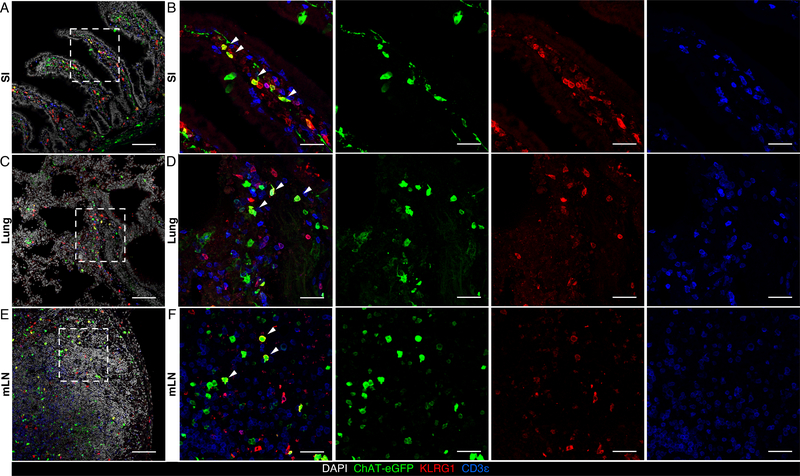
Fig. 2. ChAT-eGFP+ ILC2s in the small intestine, mLN and lung of N. brasiliensis-infected mice.
(A to F) Representative sections of small intestine (A and B), lung (C and D), and mLN (E and F) from ChAT-eGFP reporter mice analyzed on Day 7 of N. brasiliensis infection, stained for DAPI (white), ChAT-eGFP (green), KLRG1 (red) and CD3ε (blue). Arrows show representative ChAT-eGFP+ ILC2s. Data are representative of two independent experiments. Scale bars = 100 μm in (A), (C) and (E), and 30 μm in (B), (D) and (F).

