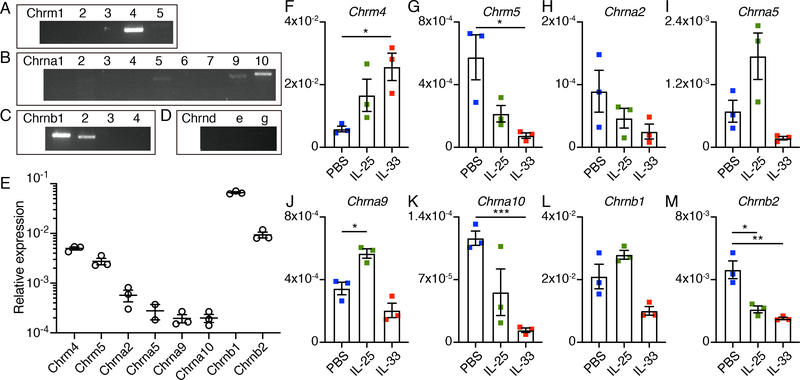
Fig. 4. AChR expression in ILC2s.
(A to D) RT-PCR analysis of expression of mAChRs (A), α-nAChR subunits (B), β-nAChR subunits (C) and other nAChR subunits (D) in small intestinal ILC2s cultured for 3 days in the presence of IL-2, IL-7 and IL-33. (E) qPCR analysis of the expression of candidate AChRs in ILC2s sort-purified from the small intestine, presented relative to Hprt1. Each symbol represents data from ILC2s pooled from 10 mice. (F to M) qPCR analysis of the expression of candidate mAChRs (F and G), α-nAChR subunits (H to K) and β-nAChR subunits (L and M) in small intestinal ILC2s cultured for 3 days with IL-2 and IL-7 alone (labeled PBS) or additionally supplemented with IL-25 or IL-33, presented relative to Hprt1. Each symbol represents data from sort-purified small intestinal ILC2s pooled from 10 mice in the PBS group, 3 mice in the IL-25 group, and 2 mice in the IL-33 group. Data are mean ± SEM. * P < 0.05, ** P < 0.01, *** P < 0.001.

