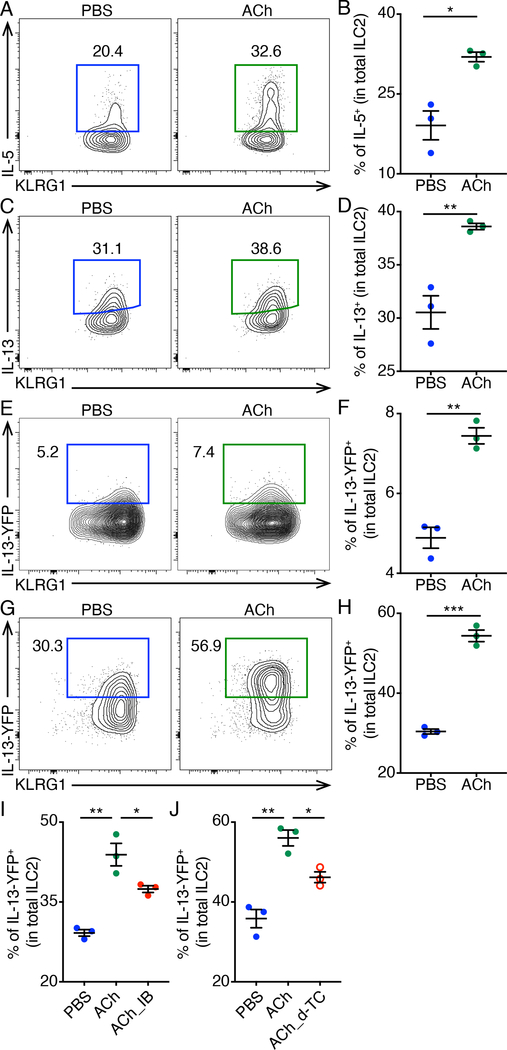
Fig. 5. Increased ILC2 cytokine production after ACh treatment.
(A to D) Representative flow cytometry plots (A and C) and population frequencies (B and D) of IL-5+ (A and B) and IL-13+ (C and D) ILC2s after 4 h incubation in medium with or without ACh, in the presence of IL-2, IL-7, IL-25, IL-33, PMA and ionomycin, as determined by intracellular cytokine staining. (E and F) Representative flow cytometry plots (E) and population frequencies (F) of IL-13-YFP+ ILC2s after 4 h incubation in medium with or without ACh. (G and H) Representative flow cytometry plots (G) and population frequencies (H) of IL-13-YFP+ ILC2s after 4 h incubation in medium with or without ACh, in the presence of IL-2, IL-7, IL-25 and IL-33. (I and J) Representative population frequencies of IL-13-YFP+ ILC2s after 4 h incubation in medium with or without ACh and indicated AChR antagonists, in the presence of IL-2, IL-7, IL-25 and IL-33. Data are representative of two independent experiments. n = 3 mice per group. Data are mean ± SEM. * P < 0.05, ** P < 0.01, *** P < 0.001.

