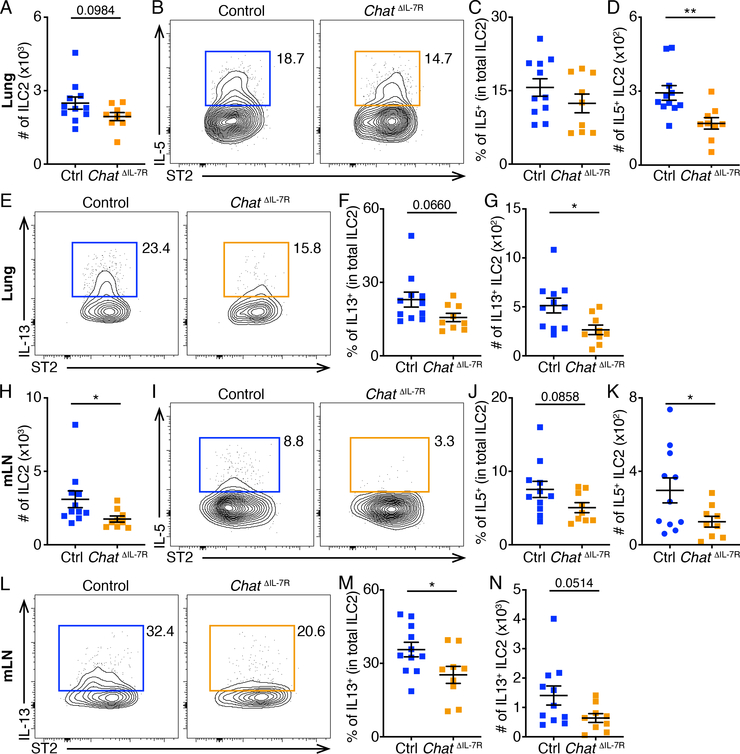
Fig. 7. Defective ILC2 responses in ChatΔIL−7R mice.
(A to N) Numbers of total ILC2s (A and H), representative flow cytometry plots (B, E, I and L), population frequencies (C, F, J and M) and numbers (D, G, K and N) of IL-5+ (B to D and I to K) and IL-13+ (E to G and L to N) ILC2s in the lung (A to G) and mLNs (H to N) of control or ChatΔIL−7R mice analyzed on Day 7 of N. brasiliensis infection. Data are pooled from three independent experiments. Control, n = 11. ChatΔIL−7R, n = 9. Data are mean ± SEM. * P < 0.05, ** P < 0.01.

