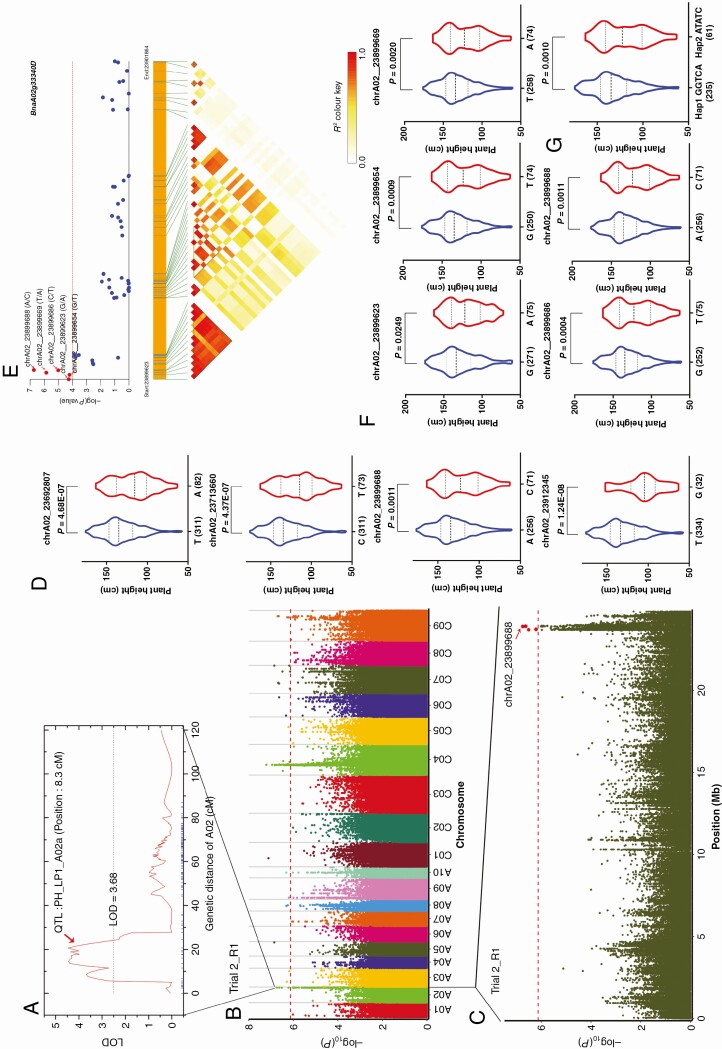
Fig. 3.
Co-localized locus on chromosome A02 for PH of B. napus at LP. (A) QTL detected for PH in the BnaTNDH population linkage analysis (Shi et al., 2013). (B) Manhattan plot of PH_LP (Trial 2_R1). (C) Peak SNP for PH_LP (Trial 2_R1). (D) Association of the co-localized locus with PH at LP. (E) Candidate gene association analysis of BnaA02g33340D. (F) Association of the five alleles in chrA02_23899623, chrA02_23899654, chrA02_23899669, chrA02_23899686 and chrA02_23899688 with PH at LP, respectively. (G) Two haplotypes of BnaA02g33340D. The number of inbred lines harbouring the corresponding allele is shown in brackets at the bottom. R1, replication 1.

