. 2021 Oct 20;21(22):4487–4497. doi: 10.1039/d1lc00406a

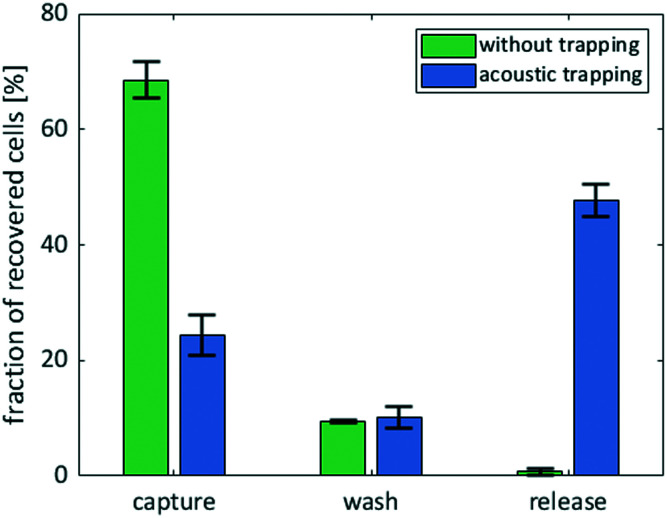
Fig. 4. Graph of fraction of initial cells recovered at the outlet during each step of the medium exchange protocol with and without acoustics at a capturing flow rate of 10 μL min−1. We calculated the cell concentrations from CFUs on non-selective plates according to eqn (9). Green: Experiments without acoustics as a control. Blue: Experiments with an excitation frequency of 1.89 MHz at 40 VPP. Capture: Cells that are not trapped and leave the device during the capture step. Wash: Cells that leave the device during the wash step. Release: Cells that leave the device during the release step suspended in the new medium. All experiments were performed in triplicates to verify the reproducibility of our method.

Fig. 4