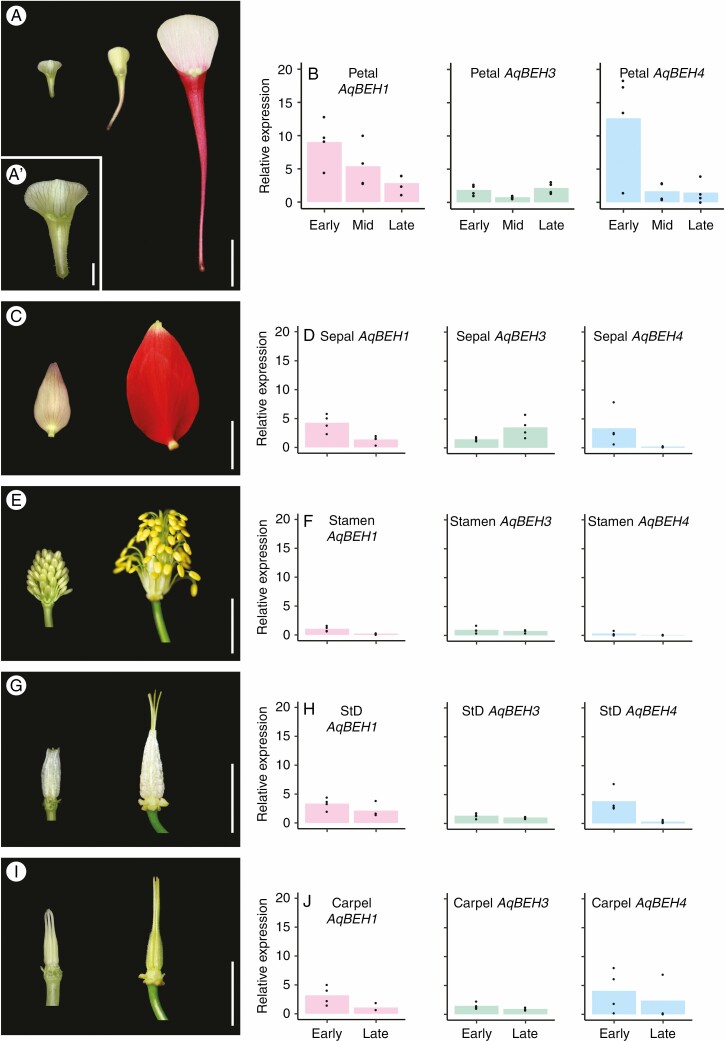
Fig. 1.
Relative expression patterns of Aquilegia BEH genes in floral organs. (A) Petals representing early, mid and late stages sampled for RT-qPCR. Scale bar = 1 cm. (A′) shows the early petal stage magnified. Scale bar = 1 mm. (C, E, G, I) Sepals, stamens, staminodes and carpels, respectively, each representing early and late stages sampled for RT-qPCR. Scale bars = 1 cm. (B, D, F, H, K) Expression of AqBEH1, AqBEH3 and AqBEH4 in each respective organ [petals, sepals, stamens, staminodes (StD) and carpels].

