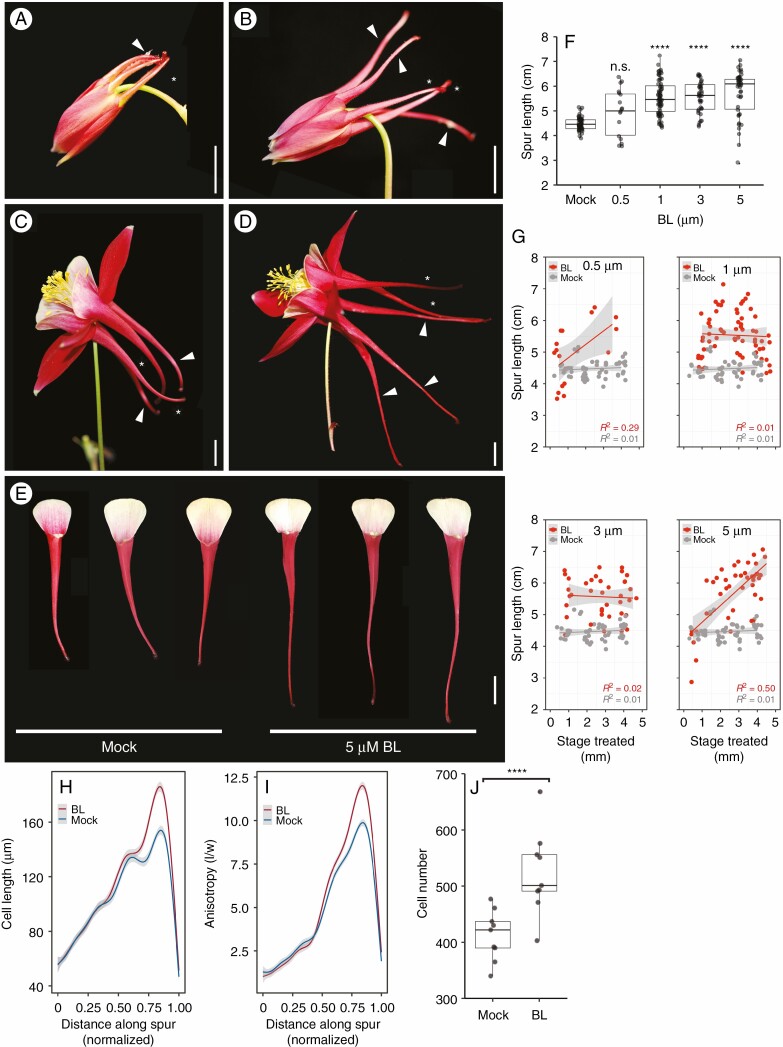
Fig. 2.
Exogenous application of BL increases spur length via increases in cell elongation, anisotropy and cell number. (A) Immature mock-treated control A. coerulea flower 2 d after treatment. Treated petals (arrowhead) are similar to non-treated petals (asterisk). (B) Immature BL-treated flower 2 d after treatment. Treated petals (arrowheads) are longer than non-treated petals (asterisks). (C) Mock-treated control mature flower. Treated petals (arrowheads) are consistent in length with non-treated petals (asterisks). (D) Brassinolide-treated mature flower. Three treated petals (arrowheads) are significantly longer than the two untreated petals (asterisks). (E) Three mock-treated petals compared with three BL (5 μm BL)-treated A. coerulea petals. All petals were treated at 3 mm spur length. (F) Spur length of mock-treated petals (n = 57) and petals treated with BL at 0·5 (n = 17), 1 (n = 69), 3 (n = 44) and 5 μm (n = 42). One-way ANOVA with Tukey HSD, ****P < 0·0001. (G) Scatterplots of spur length versus concentration, plotted by the developmental stage of spur when treated (length in mm). For 0·5 and 5 μm, the spurs are longer when treated at a later stage compared with 1 and 3 μm, where spurs are longer than mock-treated petals regardless of treatment stage. Grey band represents 95 % confidence interval. P values: 0·5 μm BL = 0·00245*, mock = 0·4489; 1 μm BL = 0·7287, mock = 0·4889; 3 μm BL = 0.775, mock = 0·4889; 5 μm BL = 1·923e-07****, mock = 0·4889. (H) Average cell length in mock-treated (n = 9) and BL-treated petals (n = 9). Spur lengths are normalized to 1·0. Grey shading represents 95 % confidence interval. Welch t-test, P < 0·0001. (I) Average cell anisotropy in mock-treated (n = 9) and BL-treated petals (n = 9). Spur lengths are normalized to 1·0. Grey shading represents 95 % confidence interval. Welch t-test, P < 0.02034. (J) Mean cell number per spur between mock-treated (n = 9) and BL-treated spurs (n = 9). Welch t-test, ****P < 0·002215. Scale bars = 1 cm.

