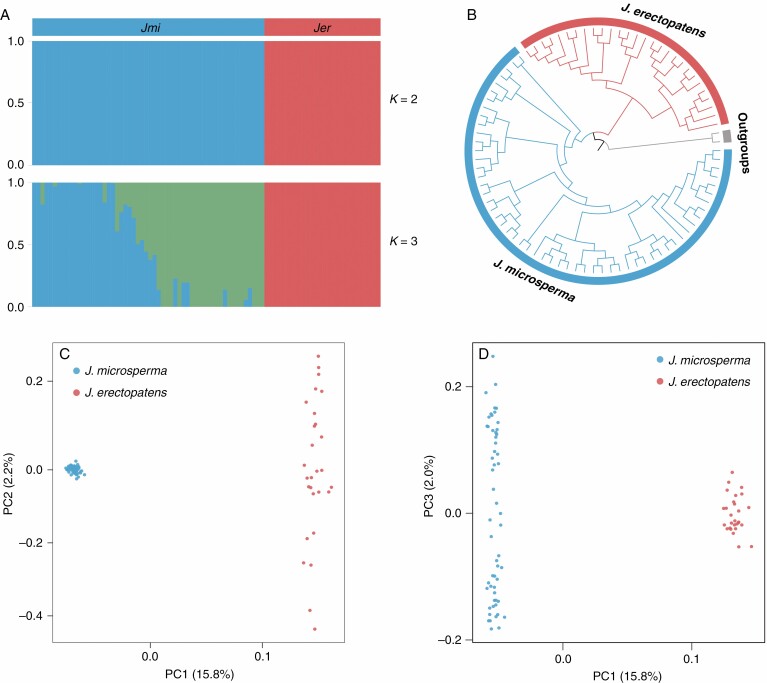
Fig. 2.
Population genetic and phylogenetic analyses of J. microsperma and J. erectopatens based on 149 052 SNPs. (A) ADMIXTURE plots for K = 2 and 3. The x-axis shows the individuals of J. microsperma (Jmi) and J. erectopatens (Jer) with each vertical bar representating an individual; the y-axis quantifies the proportion of an individual’s inferred ancestry. See also Supplementary Data Figs S2 and S3. (B) Maximum-likelihood phylogenetic tree. (C, D) Principal component analysis (PCA) plots of the two studied species showing PC1 vs. PC2 and PC1 vs. PC3, respectively.

