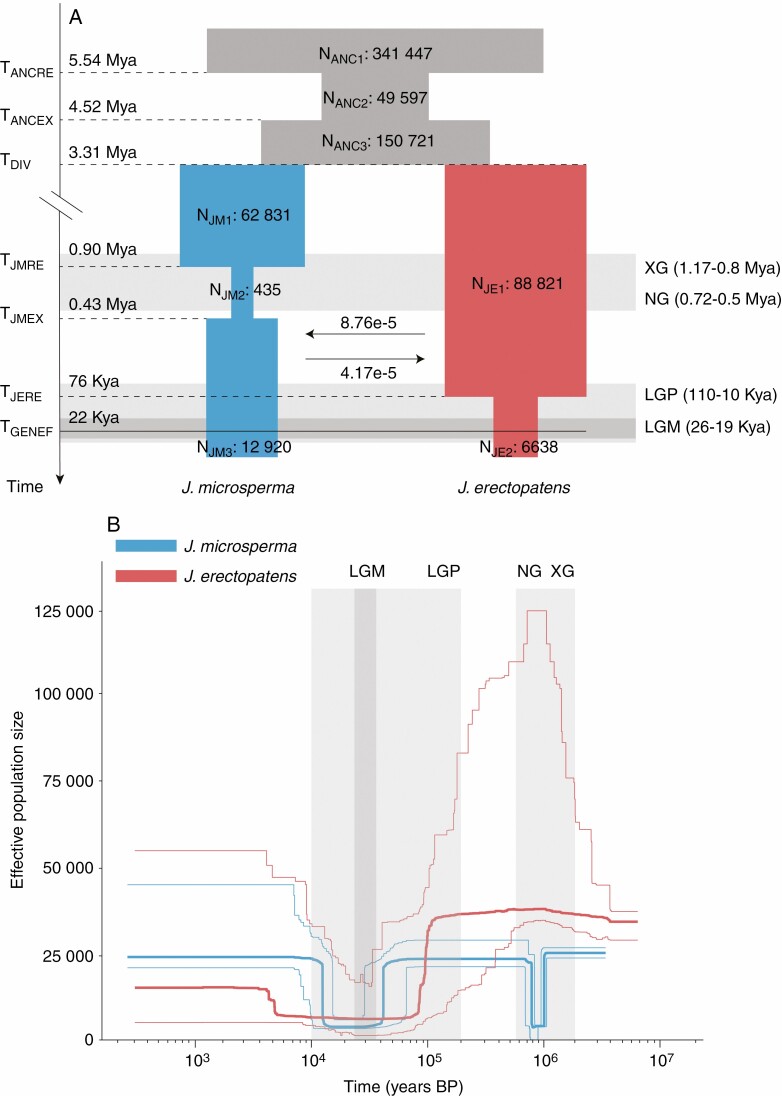
Fig. 5.
Demographic history of J. microsperma and J. erectopatens. The light grey areas represent different glaciation events during the Pleistocene (XG, Xixiabangma Glaciation; NG, Naynayxungla Glaciation; LGP, Last Glaciation Period; LGM, Last Glaciation Maximum). (A) Schematic illustration of the best demographic scenario using fastsimcoal2. Estimated effective population sizes (Ne), divergence time, bottleneck time and phased gene flow are indicated. The number next to the horizontal arrows represents the per-generation migration rate between populations. The full line indicates the time when gene flow stopped. See also Supplementary Data Table S5. (B) Changes in Ne over time in J. microsperma and J. erectopatens inferred by the Stairway Plot method. Thick and thin light lines represent the median and the 95 % pseudo-CI defined by the 2.5 % and 97.5 % estimations, respectively, using the site frequency spectrum analysis.

