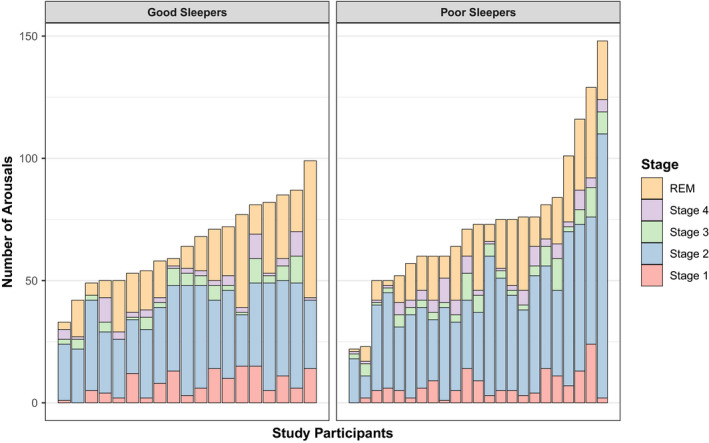
FIGURE 1.

Inter‐individual variability in arousal counts across sleep architecture for good and poor sleepers. Each bar represents an individual participant. Good and poor sleepers are on the left‐ and right‐hand sides of the graph, respectively. The highest scorers belong to the poor sleeping group, although clear group differences do not appear to be present. A chi‐square test of independence showed the poor sleepers differ significantly in the way the arousals are distributed across the stages of sleep compared to the good sleeping group, highlighting a group and stage association with respect to arousal count
