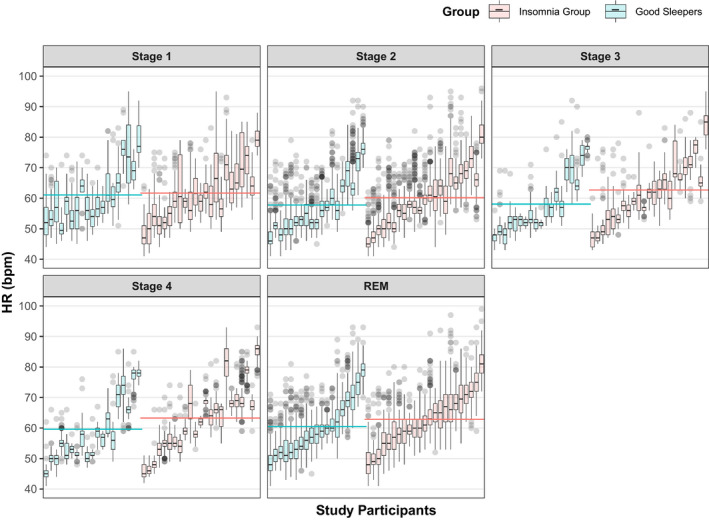
FIGURE 3.

Boxplots highlighting the variability in nocturnal heart rate (HR) between and within individuals across sleep stages (n = 42). Each boxplot represents an individual participant and the grey dots represent outliers. The dashed red line indicates mean HR for each group. Green boxes denote individuals in the good sleeping group, while orange shading denotes individuals in the insomnia group. While the mean HR of the two groups is closely matched at sleep Stage 1, the difference becomes increasingly more apparent towards deeper stages of sleep (Table 4). Considerable inter‐individual variability between participants is also demonstrated
