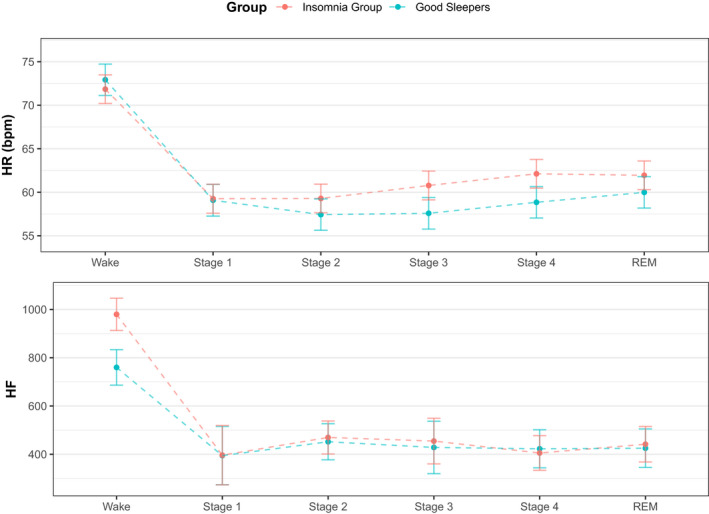
FIGURE 4.

Model estimates of heart rate (HR) and high frequency heart rate variability based on frequency bands from spectral analysis of HR variability (HF). Top: The difference in nocturnal HR across sleep stages and groups is highlighted, with the reduction in HR for the insomnia group attenuated across all stages of sleep (apart from Stage 1) when compared to the good sleepers. Bottom: HF is highlighted across sleep stages and groups. The insomnia group display increased HF ratio during Wake across the night, which narrows from Stages 1 to rapid eye movement (REM). Values are mean ± SE
