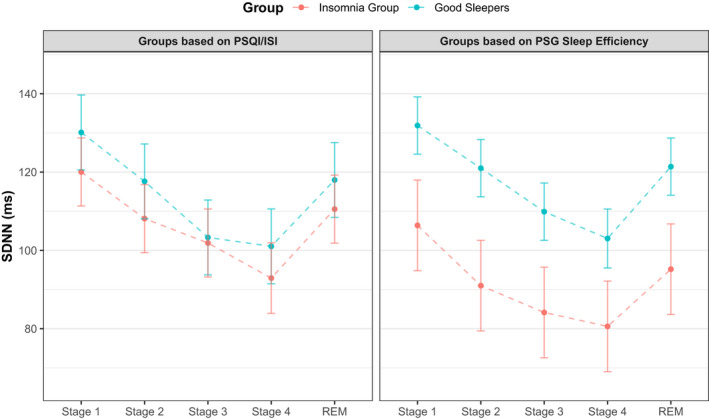
FIGURE 5.

Model estimates of the standard deviation of the R–R interval (SDNN). Left: Group differences in SDNN across sleep stages, with groups defined by subjective sleep. A decline in SDNN from Stage 1 to 4 is observed. There is no discernible difference between groups. Right: Group differences in SDNN across sleep stages, with groups defined by objectively measured sleep (sleep efficiency > and <90%). As with the subjective groupings, a decline in SDNN is noticeable from Stage 1 to Stage 4. Values are mean ± SE
