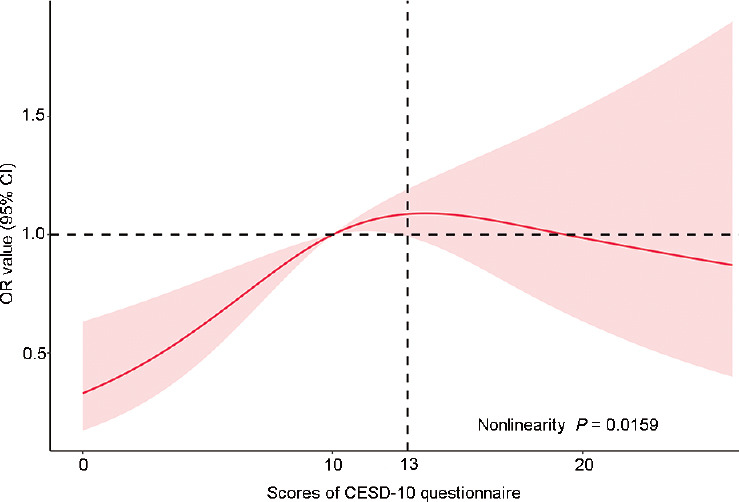
Figure 3.

Restricted cubic spline regression between depression and LUTS/BPH. The red area was drawn using the data from the 95% CI. OR: odds ratio; CI: confidence interval; CESD-10: Center for Epidemiological Studies Depression Scale-10; LUTS/BPH: lower urinary tract symptoms suggestive of benign prostate hyperplasia.
