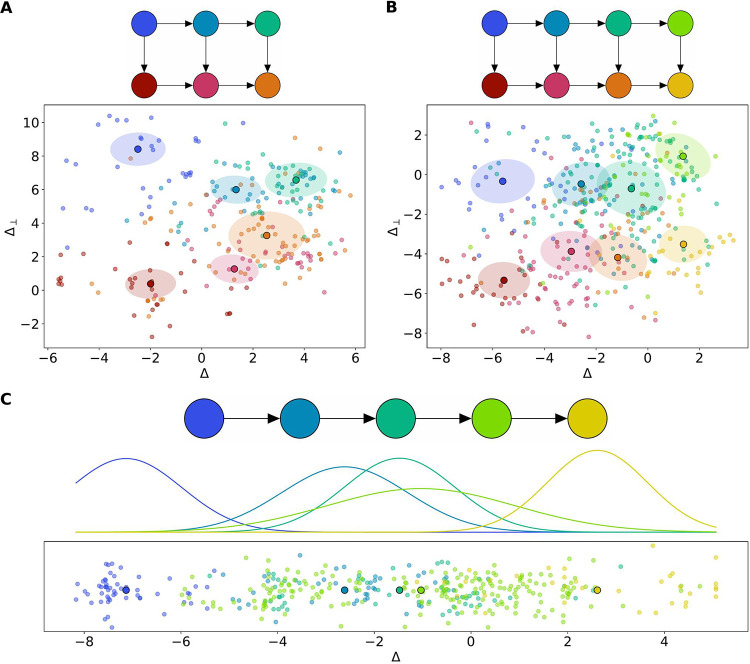
FIG 3.
Projections of MaPS-seq data. (A) Distal colon data set. The selected model and MaPS-seq data projected along the unit Δ and Δ⊥ axes. Colors correspond to samples belonging to a latent cluster. Ellipse radii represent the eigenvectors of the covariance matrix. (B) Cecum data set. (C) Ileum data set. Selected model and MaPS-seq data are projected along the unit Δ axis. Normal distribution represents the density of covariance matrices around each cluster mean.

