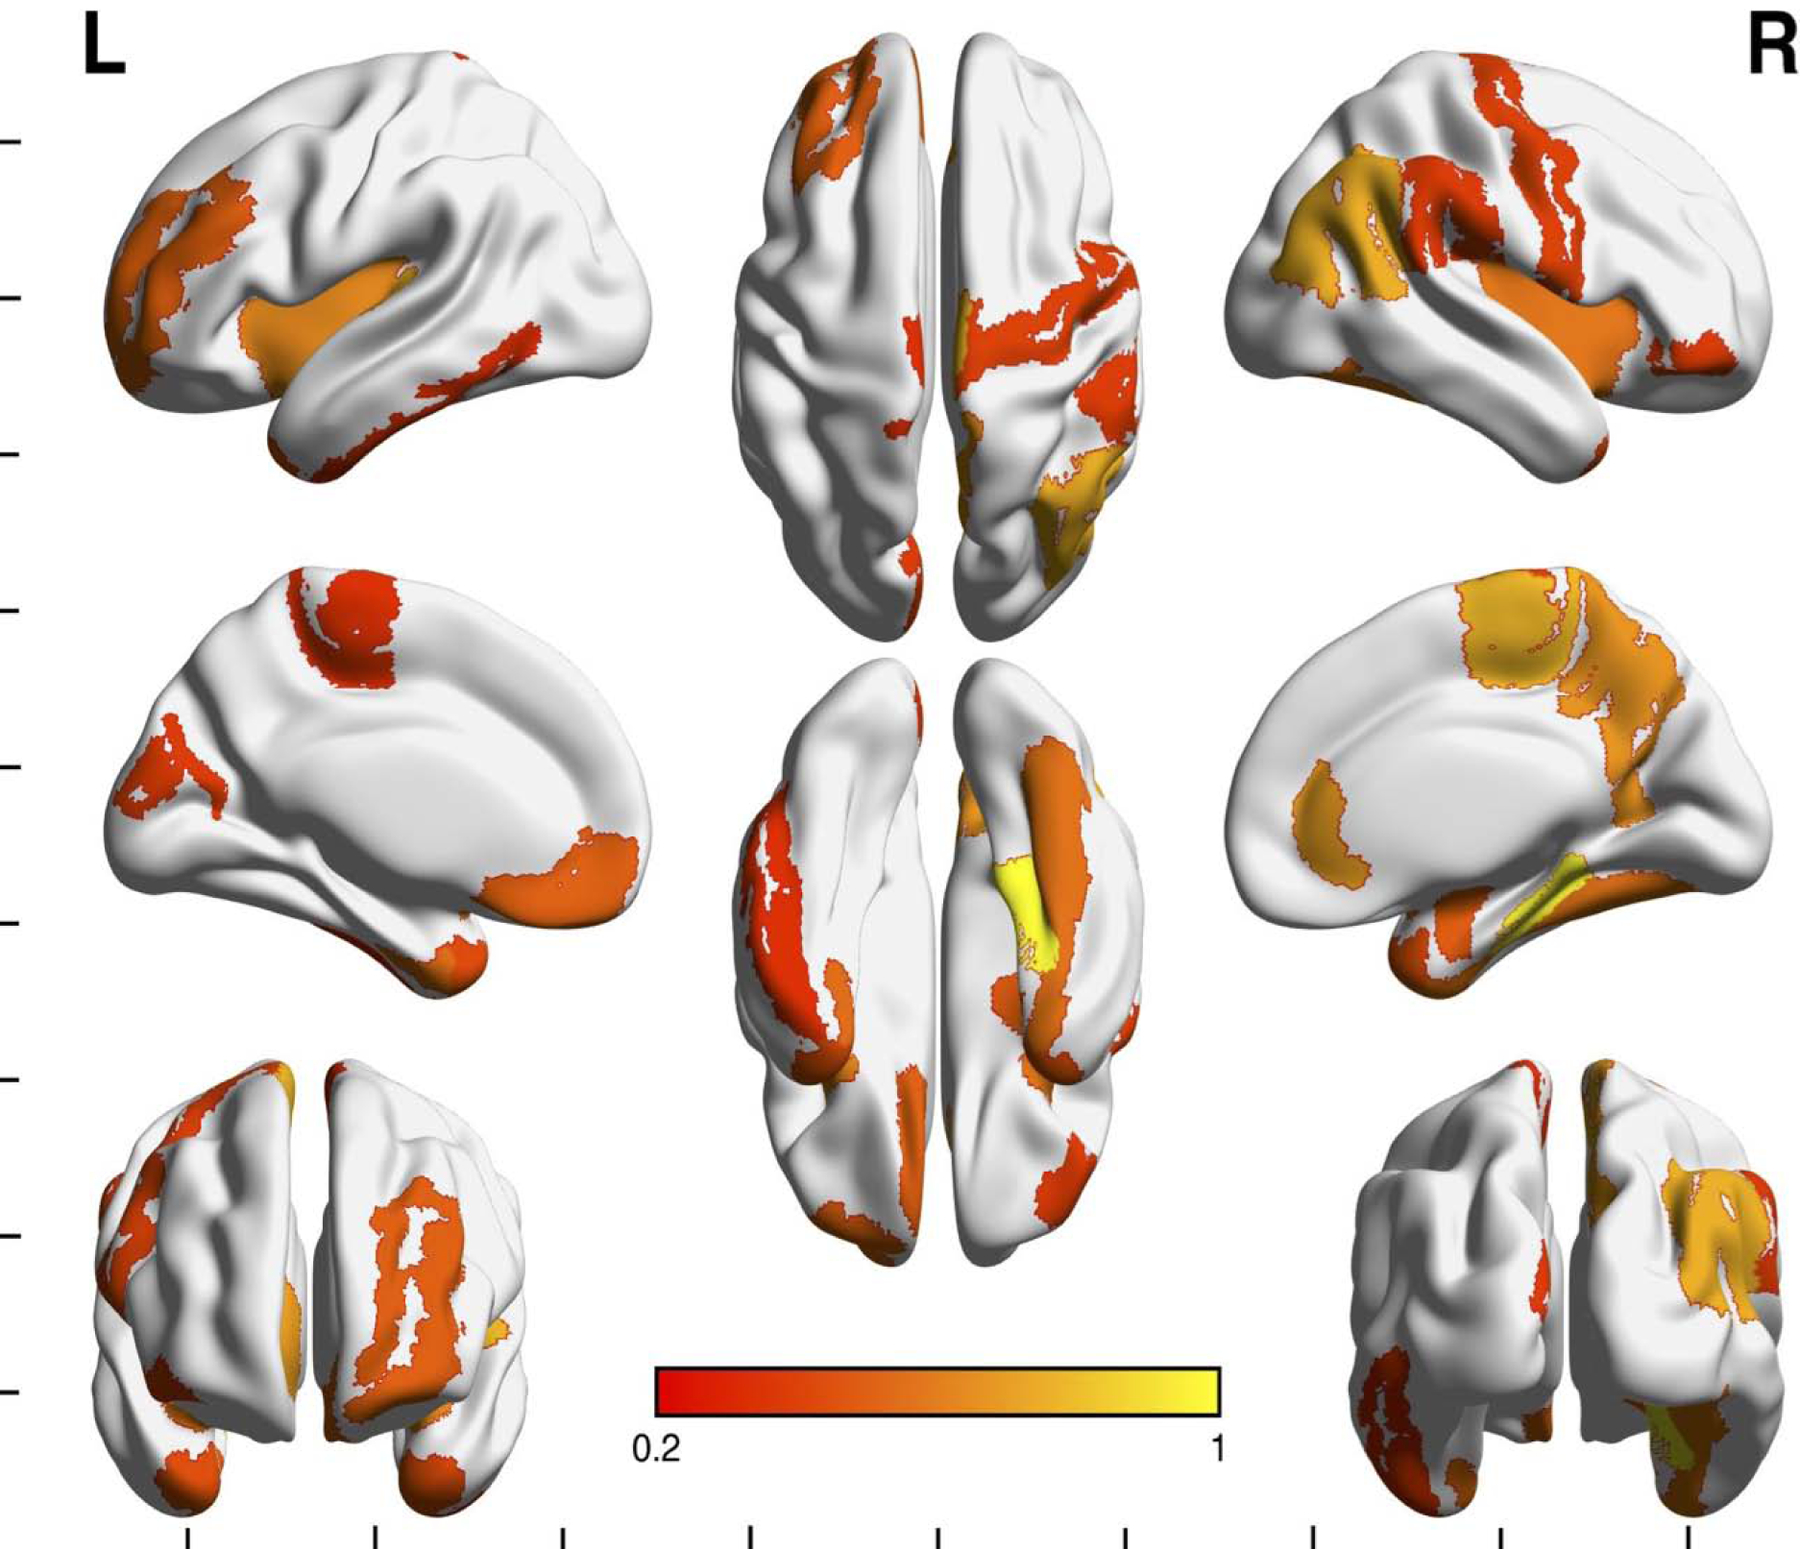
Figure 2. Brain regions highlighted in the support vector machine learning model.

Multi view surface rendering depicting cortical regions that were highlighted in the support vector machine learning (SVM) model. Shading indicates regions contributing to the model with a squared weight >/= 0.1. Shading in bar indicates value of squared weight. Not pictured are subcortical regions (left caudate, left pallidum, right amygdala, right pallidum). See Supplement for color version of this figure.
