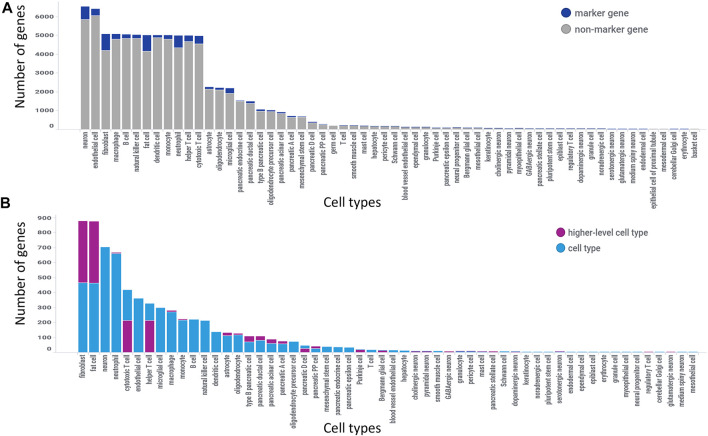
FIGURE 4.
GeneMarkeR summary statistics. (A) Number of marker genes identified (dark blue) out of all genes analyzed per cell type (length of bar). (B) Number of marker genes reclassified as a higher-level cell type marker (purple) and number of marker genes classified as cell type-specific marker (light blue) out of all marker genes identified for that cell type (length of bar). Figure 2B is filtered to the marker genes, i.e., dark blue bars in figure 2A. Both figures are sorted from largest to smallest number of genes.

